D3.js Visualization, a Quasi Science
i realized, that d3js is so weird, cuz the author is creating/following a sort of “new way of thought” on visualization. The quasi-science is similar to Buckminster Fuller 's stuff e.g. “spaceship earth”, ephemeralization, synergetic.
famous programers who are quasi-science are Larry Wall of perl fame, and Martin Fowler of UML, “patterns”, and eXtreme Programing fame.
the things they say, are not exactly incorrect, since they are never about math, but usually methodology/approach, naming. Our scientific basis to assess approach or jargons, is not mature or practical, since methodology/approach and lexicon are tied with culture and style. So, we can't bluntly say they are wrong.
The thing is that, they push it, usually inventing lots jargon on the way, and creating a cult following.
example of quasi-science, contrasting math vs computing. In math, things are well defined, a theory is either correct, or not. In programing, you have methodologies, “patterns”, OOP, FP, haskell vs clojure, “unix philosophy” etc, cuz it's not well defined.
here's a great article by the author of d3js. Especially near the bottom.
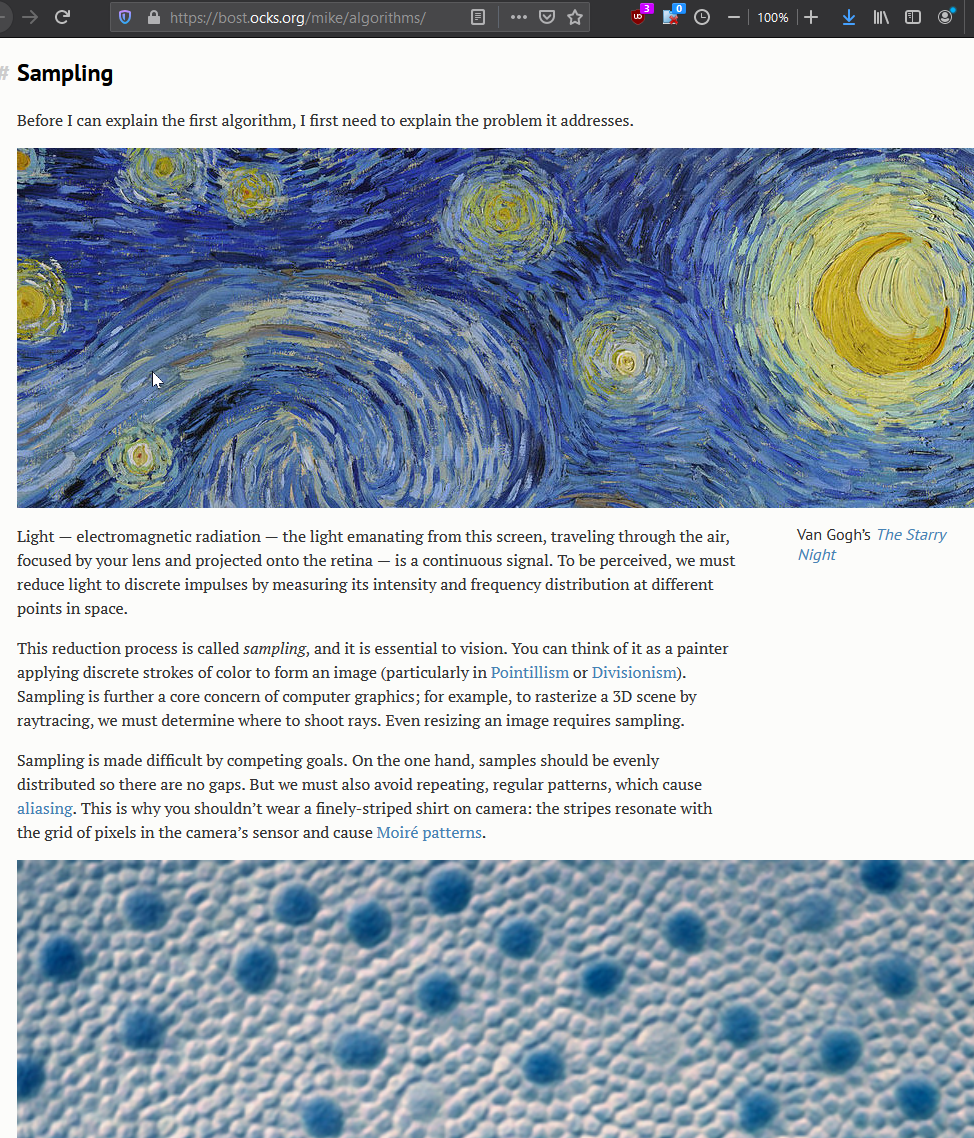
- Visualizing Algorithms
- By Mike Bostock.
- https://bost.ocks.org/mike/algorithms/
The first part of that article, on sampling, has the color of quasi-science. You see that, Mike put in a particular perspective, and dragging in human retina. He basically wants to generate random dots in a plane. However, he regard it as “sampling”. That's kinda a point of view. If you want to have a random dots in a plane, just say so, and specify your requirement, such as there shouldn't be empty area etc, in a mathematical way, then you would have mathematically precise solutions, or algorithms. You can speak of it as “sampling”, but that's the thing, this is where styles and opinions and interpretations creeps in.
well, i don't have strong objection on what he's doing there.
but the sense i got that he's doing some culty thing, is when i read his article about d3 scale.
- Introducing d3-scale
- By Mike Bostock.
- https://medium.com/@mbostock/introducing-d3-scale-61980c51545f
quote:
I'd like D3 to become the standard library of data visualization: not just a tool you use directly to visualize data by writing code, but also a suite of tools that underpin more powerful software.
To this end, D3 espouses abstractions that are useful for any visualization application and rejects the tyranny of charts.
The article is actually excellent. It introduces you to d3's concept of scale and functions.
however, from the above quote, and the way he discusses it, you can see that, he's going about it in a particular way.
normally, a “scale” or scaling function in math, is a function that maps from a numerical range to another.
his sense of “scale”, is a generalization of that, to include quantification of non-numerical data into “visual elements”. In his words:
with abstract data there are also non-quantitative dimensions; for example, diamond cut quality (fair, good, very good, ideal) is ordinal, while diamond cut shape (princess, round, marquise, etc.) is categorical.
So, the way he discusses this, is that d3's sense of scale is actually non-standard. For example, it includes a thing called “band scales” which is used to generate widths and gaps for bar charts.
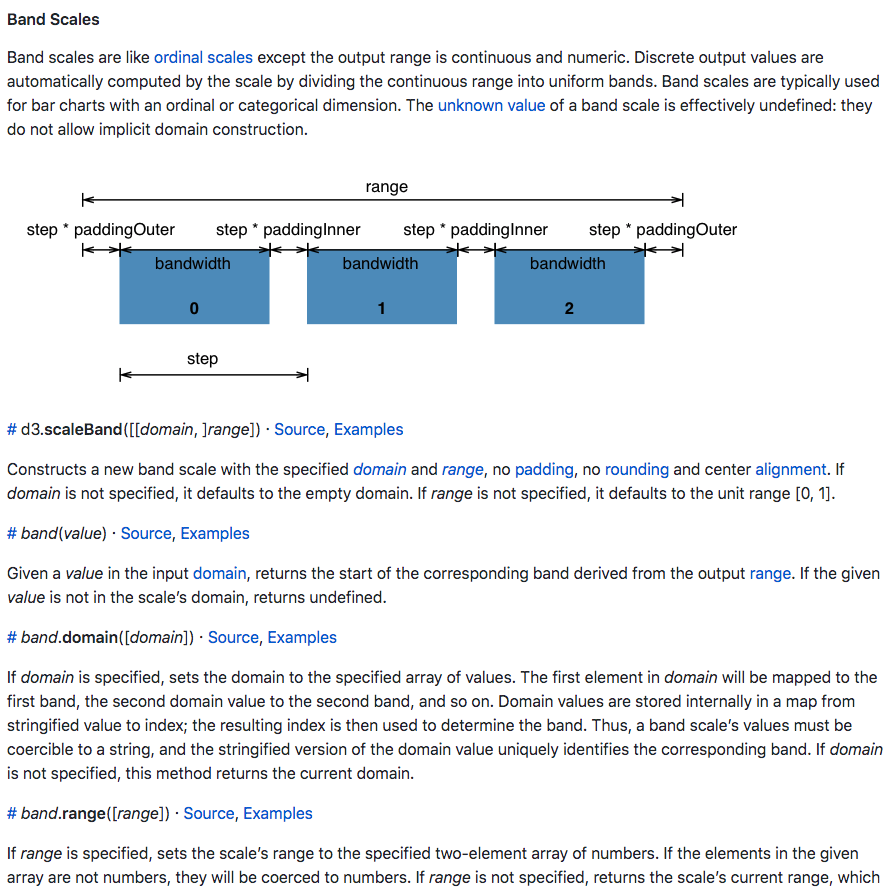
and you can see from d3js's scale documentation
https://github.com/d3/d3-scale#ordinal-scales
it includes lots of things, its a system. But am not sure his way is standard or conventional. Certainly his concepts and jargons are not in any part of standard mathematics or geometry. Nor are they standard parts of computer science. They might be common, or uncommon, practice and naming, in the narrow field of “visualization”, if there is such a thing. It might be that he partially invented the whole thing. No wonder, d3 is weird. And this is the part about quasi-science and cult.
Note, there is no branch of science of “visualization” per se. (but there are courses, journals, seminars, selling it, just as there are such for “agile methodology” in programing.) The most famous “visualization” expert is Edward Tufte by his book The Visual Display of Quantitative Information [Buy at amazon ] in the 1990s.
The very subject matter is kinda a cult, not well defined, multi-disciplinary, wishy-washy thing. It's like programing's OOP or Functional Programing. There are gods and followers. One thing is sure, is that it is not math nor science.