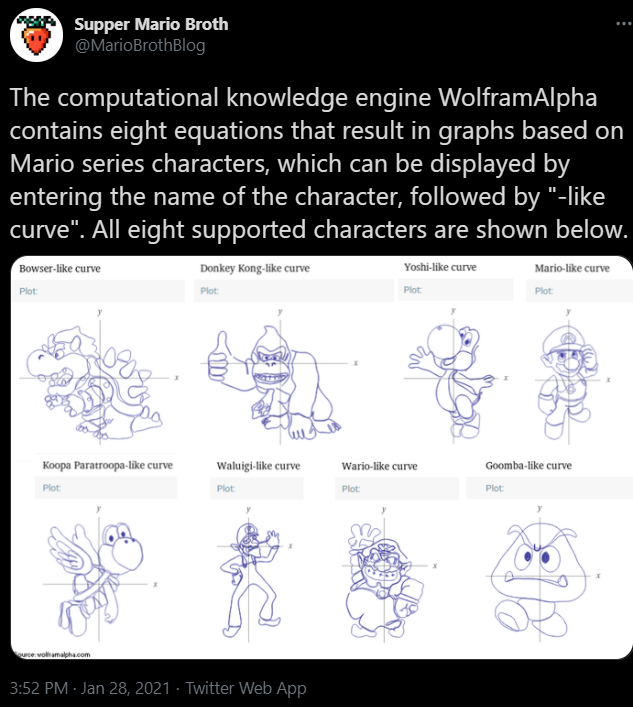
parametric cartoon curve
is there a algorithm that turns a drawing into parametric curves?
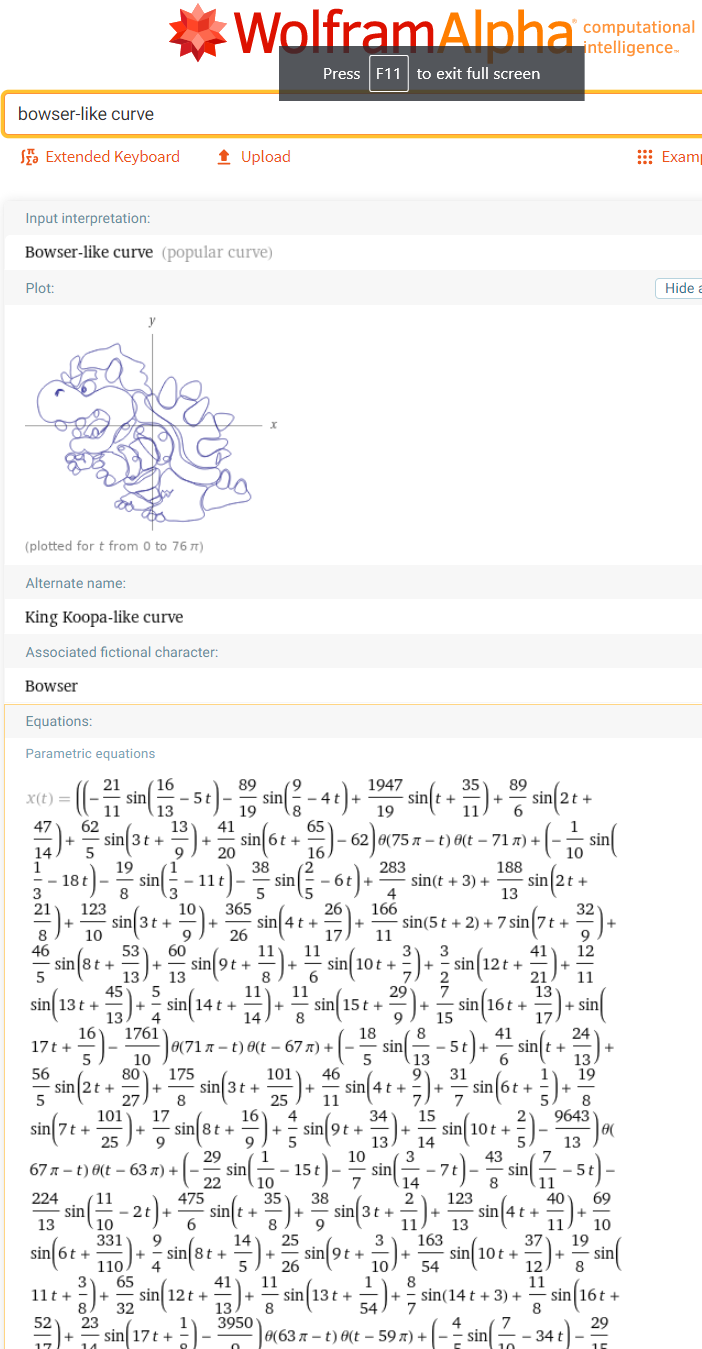
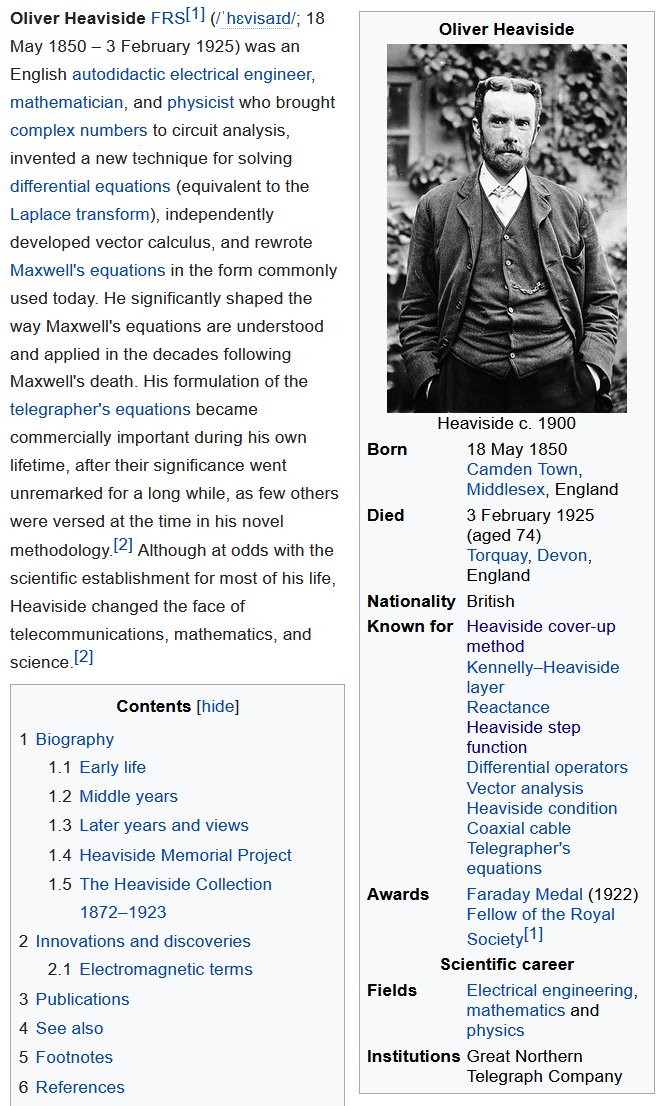
Ok. I think i know. The general simplest non-trivial case is to draw 2 arbitrarily shaped ovals, as 2 loops. We can focus on drawing one loop first. It'll have the form {f,g} with sine in both, basically a deformed circle. To draw 2nd or more loops, find the t range for the loops, e.g. Range1=[t1Min,t1Max], range2=[t2Min,t2Max], shift them so that t1Max == t2Min. This solves the drawing multiple loops problem. Unit step function (aka Heaviside step function) can be used if needed for lifting pen. Heaviside step function
Now, how do you find the parametric equation for a cartoon loop? Basically, you use curve fitting methods. The loop is a sequence of {x,y} data points. Decompose the loop's x and y axis movements. Lets focus on the x-axis first. You get a sequence of values. You just find a function for it. It can be a polynomial function. This is easy as there are established algorithms. But creating a sine function shouldn't be difficult, either directly from data or turning the polynomial into sine.
- Making Formulas… for Everything—From Pi to the Pink Panther to Sir Isaac Newton
- By Michael Trott.
- https://blog.wolfram.com/2013/05/17/making-formulas-for-everything-from-pi-to-the-pink-panther-to-sir-isaac-newton/