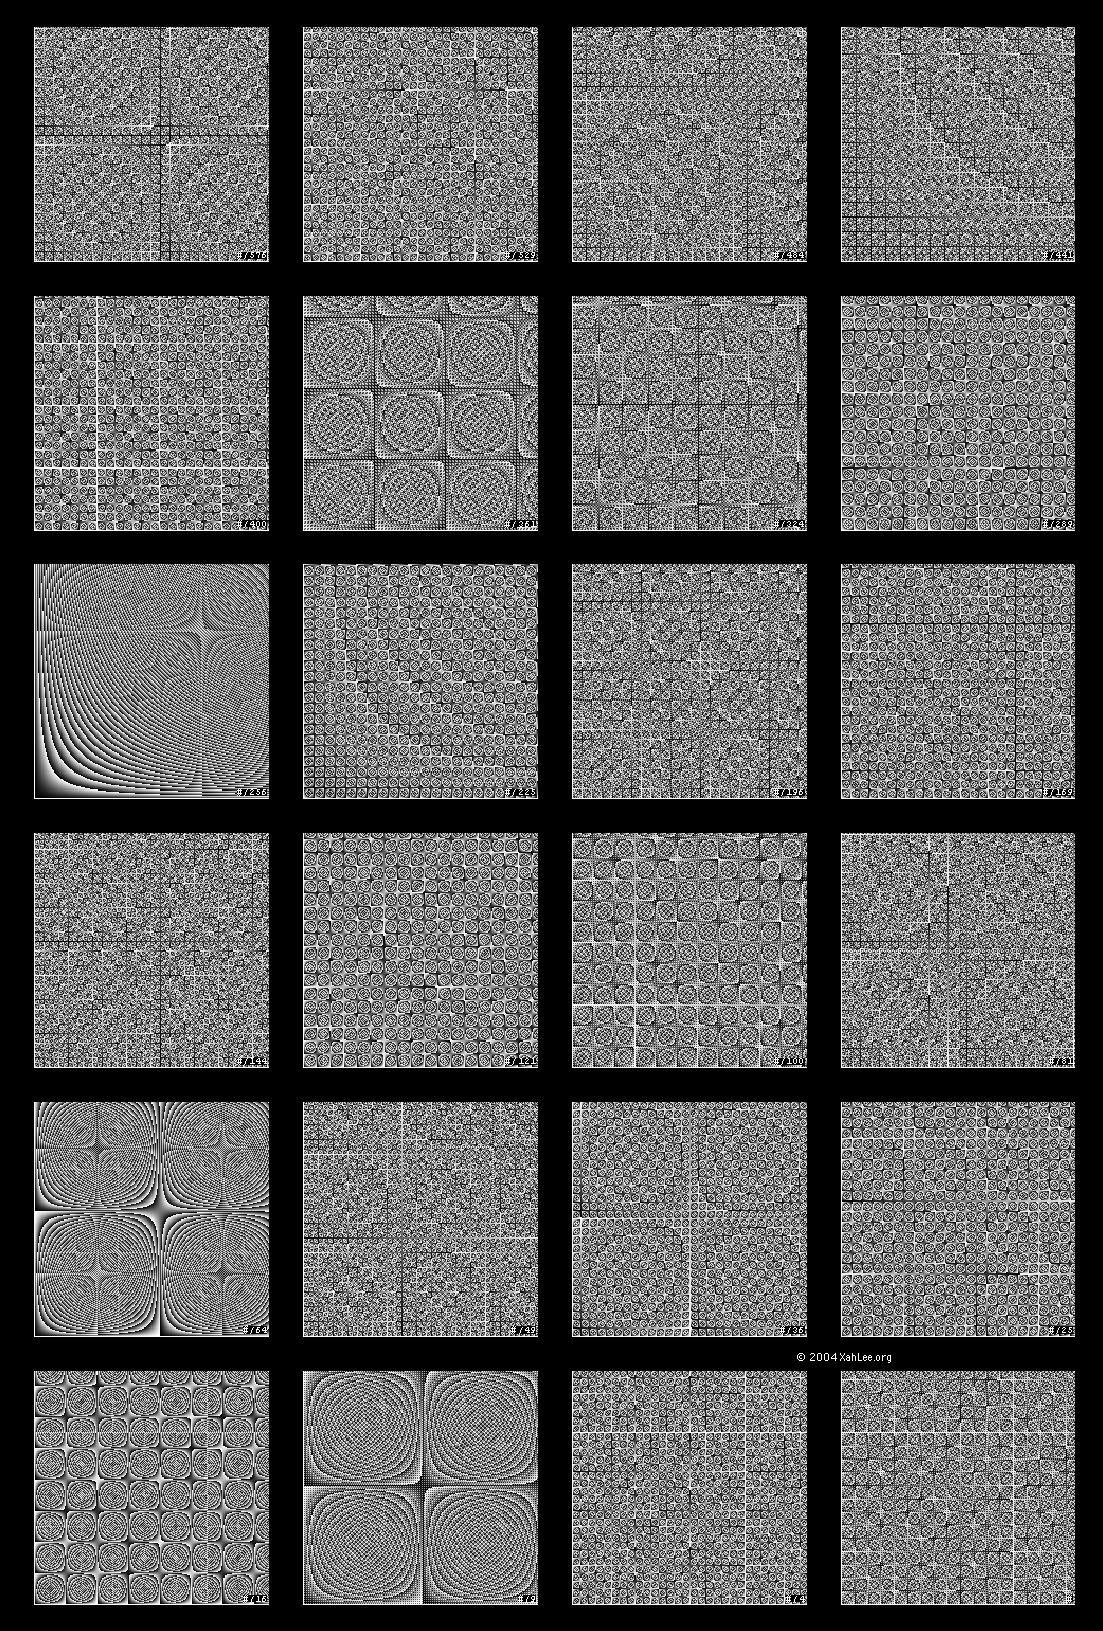
Heatmap of Trig Expressions
The following are density plots of arbitrary expressions of one term involving trig functions.
Blood Tinge
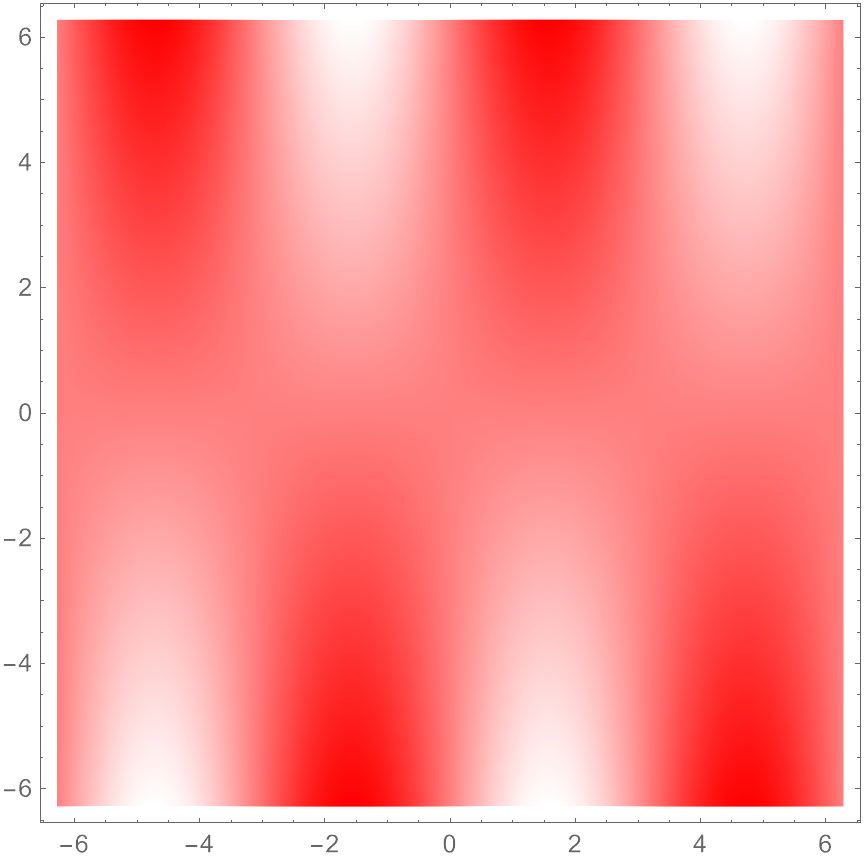
DensityPlot[y  Sin[x],
{x, -2  Pi, 2  Pi},
{y, -2  Pi, 2  Pi},
 ColorFunction -> Function[x, Hue[0, x, 1]],
PlotPoints -> 30,
MaxRecursion -> 4]

Plot3D[
y Sin[x],
{x, -2 Pi, 2 Pi},
{y, -2 Pi, 2 Pi},
ColorFunction -> Hue,
PlotPoints -> 30,
MaxRecursion -> 4
]
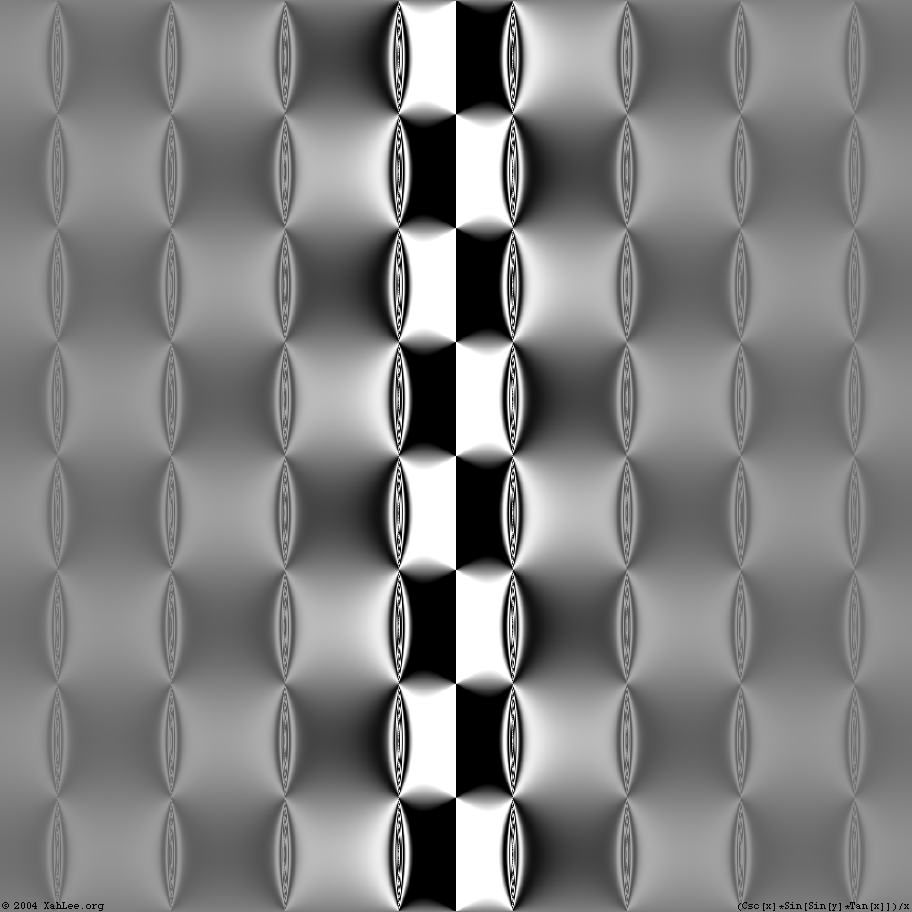
B Curtain
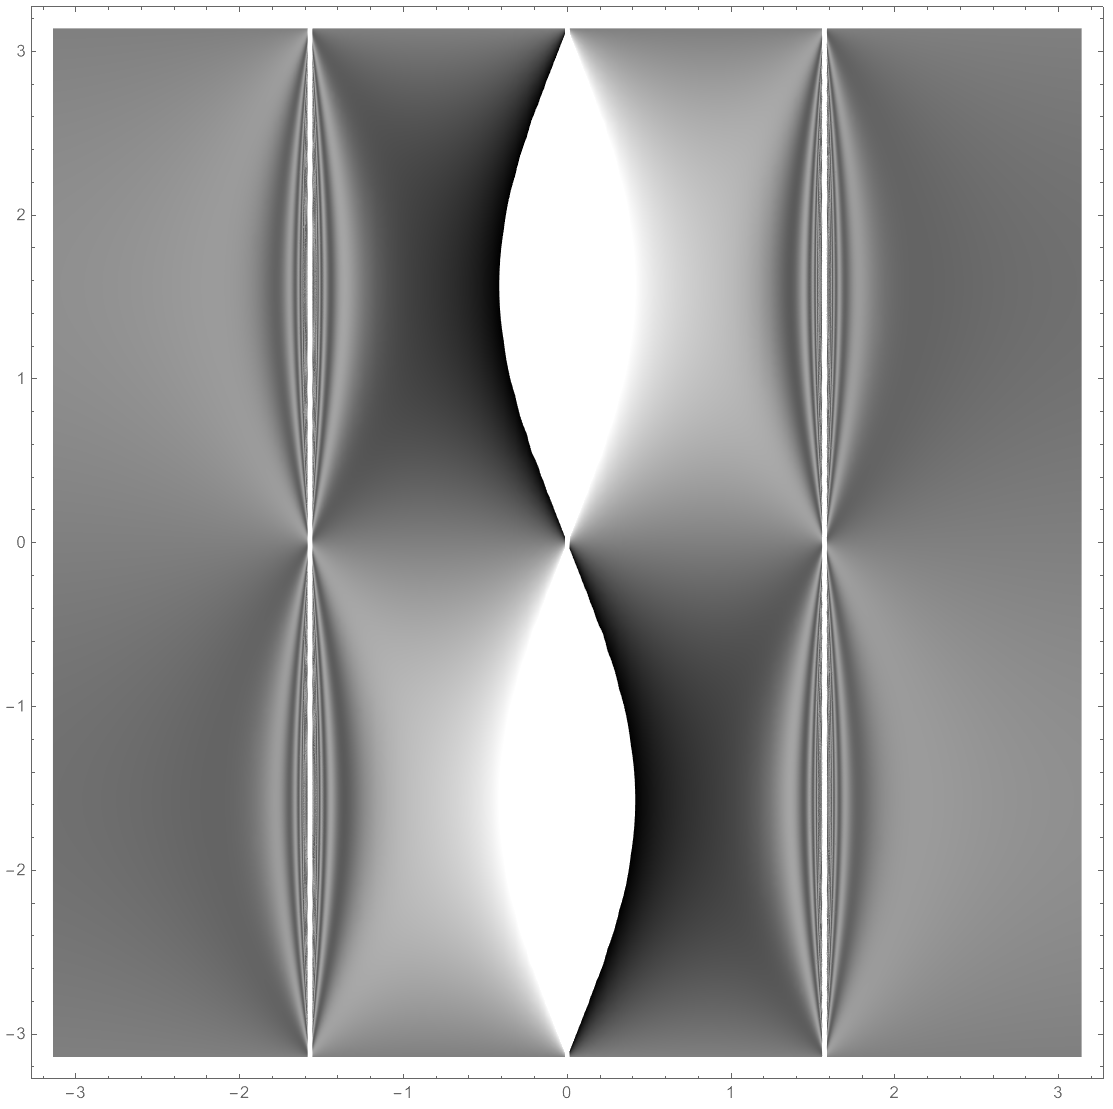
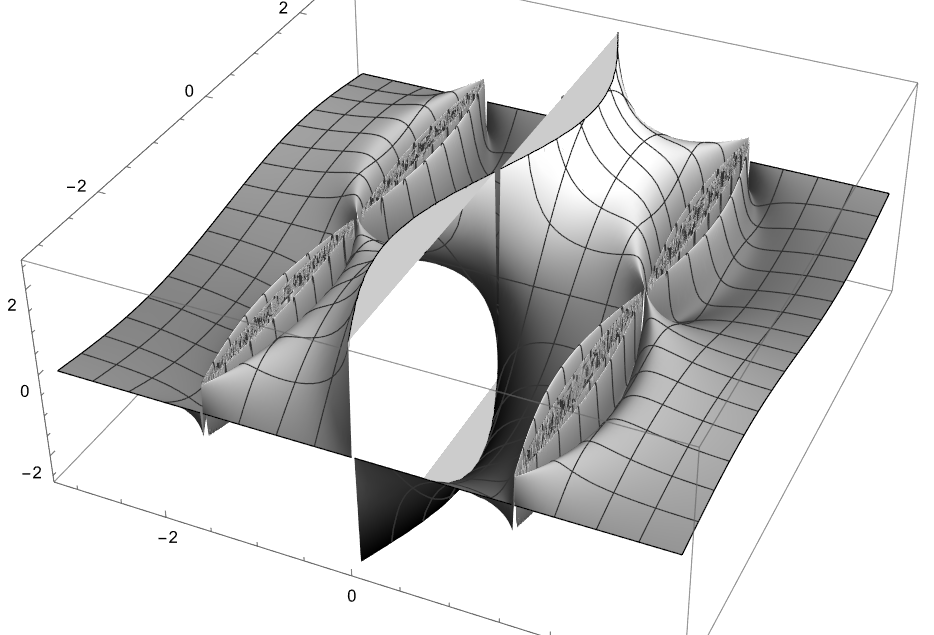
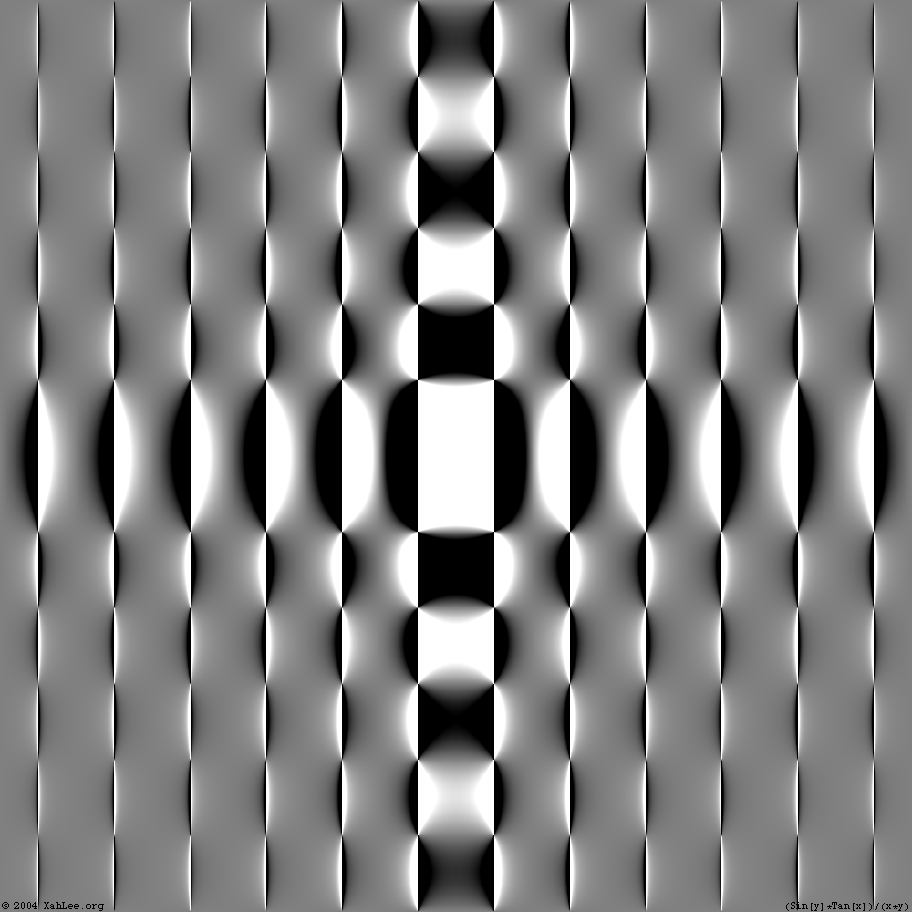
DensityPlot[(Csc[x] Sin[Sin[y] Tan[x]])/x,
{x, -Pi, Pi},
{y, -Pi, Pi},
ColorFunction -> GrayLevel,
MaxRecursion -> 5,
PlotPoints -> 90]

Plot3D[(Csc[x] Sin[Sin[y] Tan[x]])/x,
{x, -Pi, Pi},
{y, -Pi, Pi},
ColorFunction -> GrayLevel,
MaxRecursion -> 5,
PlotPoints -> 90]
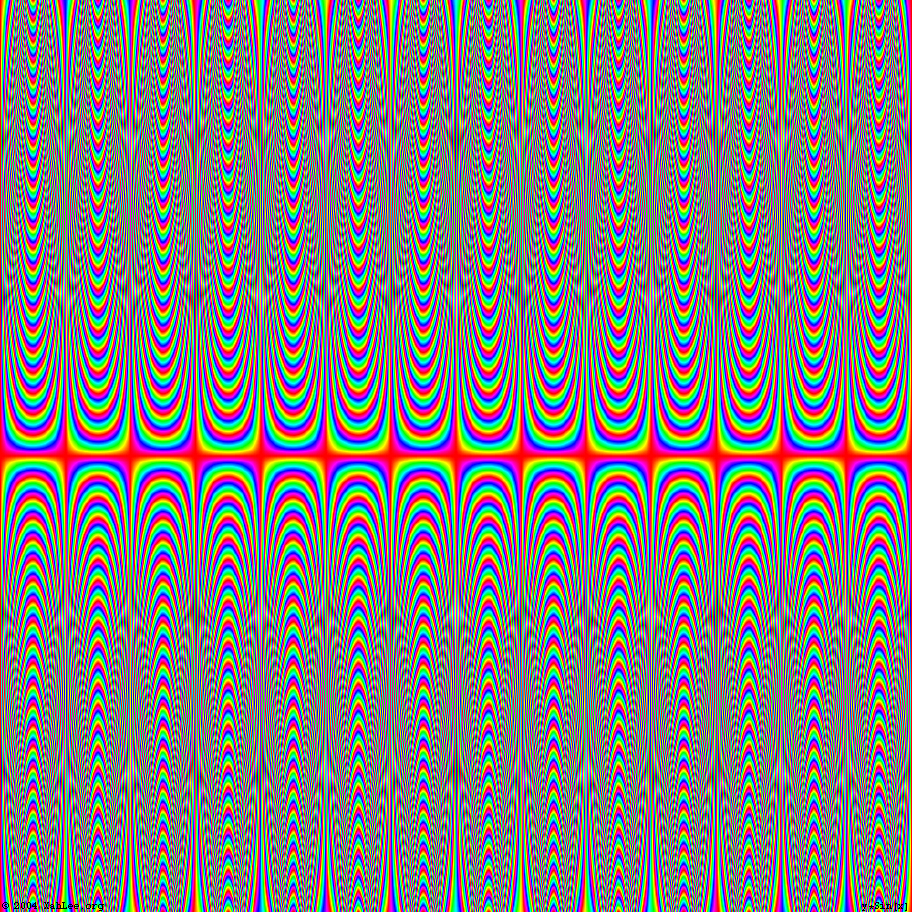
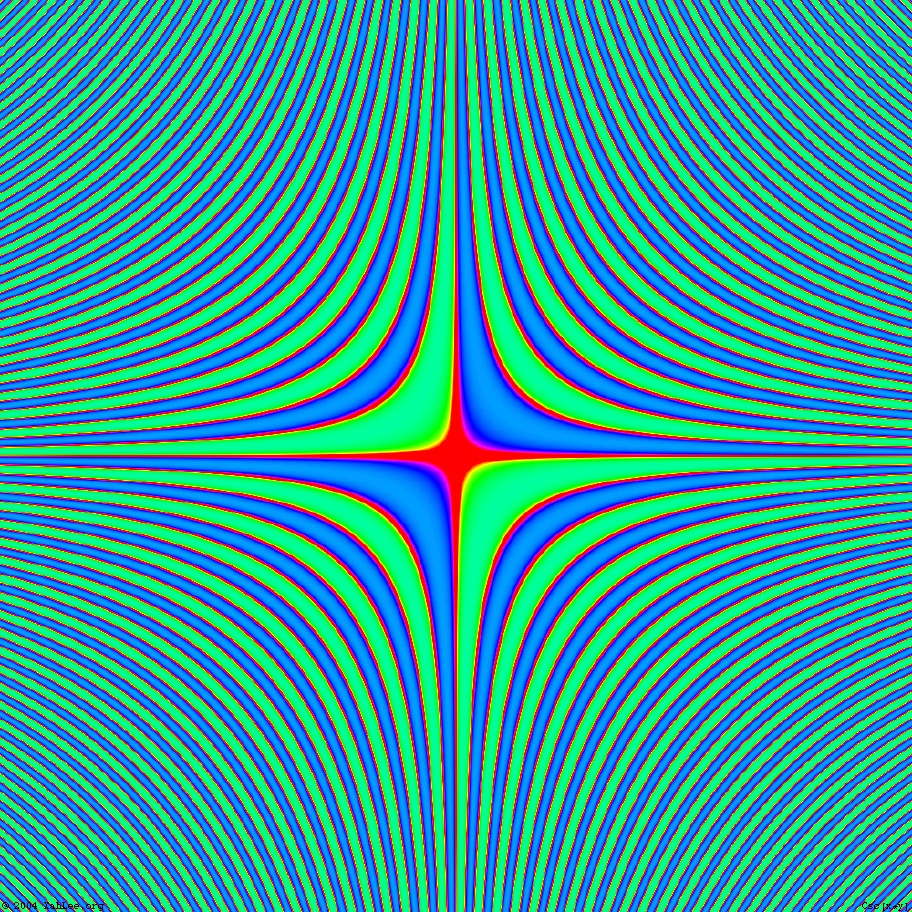
Lens Valley
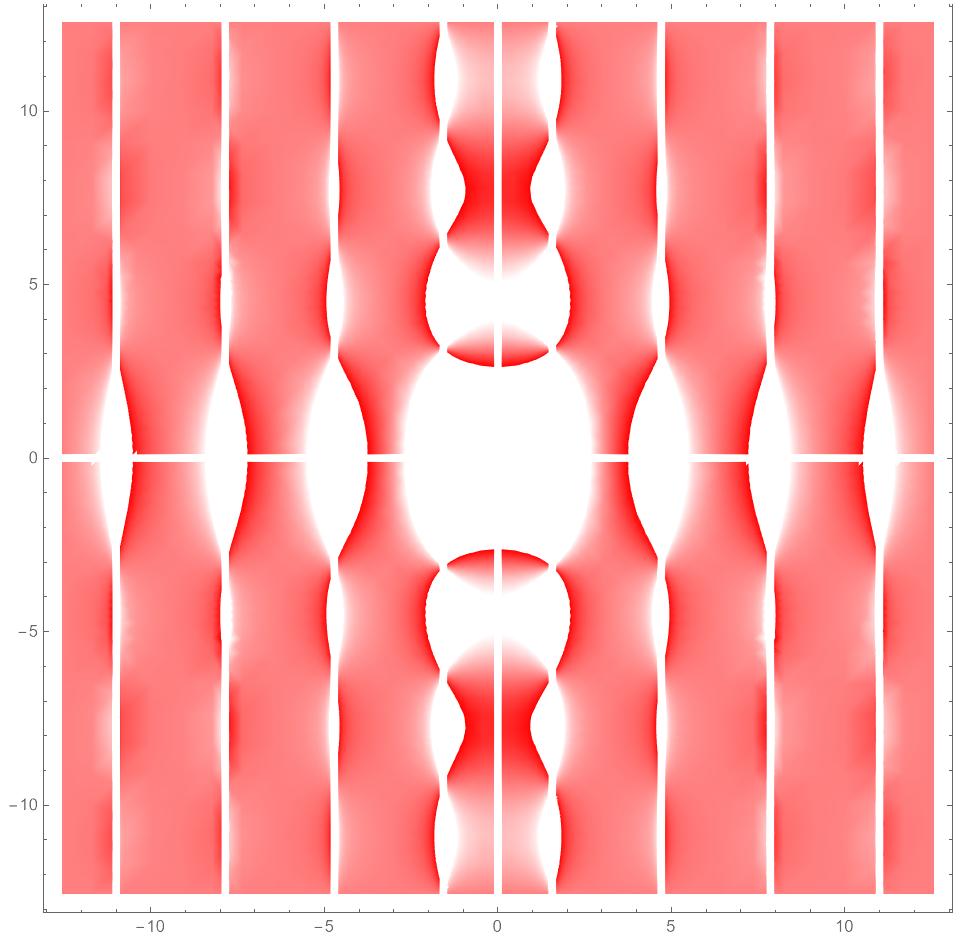
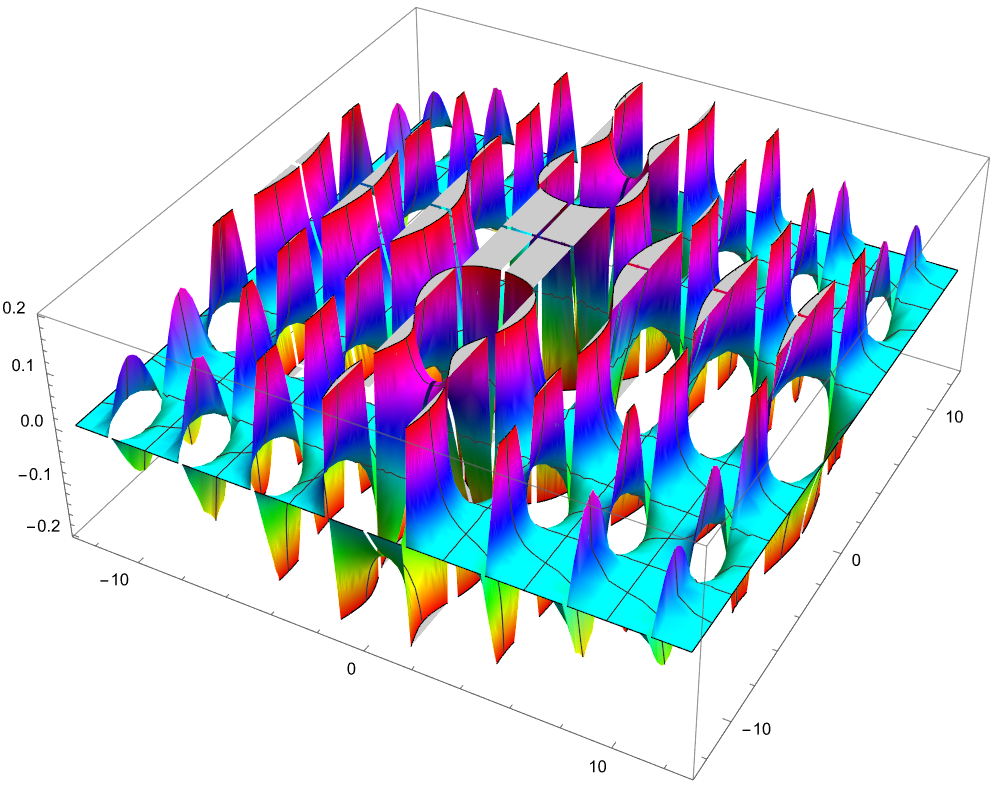
DensityPlot[
(Sin[y] Tan[x])/(x y) ,
{x, -4 Pi, 4 Pi},
{y, -4 Pi, 4 Pi},
 ColorFunction -> Function[x, Hue[0, x, 1]],
PlotPoints -> 30,
MaxRecursion -> 4]

Plot3D[
(Sin[y] Tan[x])/(x y) ,
{x, -4 Pi, 4 Pi},
{y, -4 Pi, 4 Pi},
ColorFunction -> Hue,
PlotPoints -> 30,
MaxRecursion -> 4
]
Trough Field
DensityPlot[
Csc[x y],
{x, -2  Pi, 2  Pi},
{y, -2  Pi, 2  Pi},
PlotPoints -> 30,
MaxRecursion -> 4]
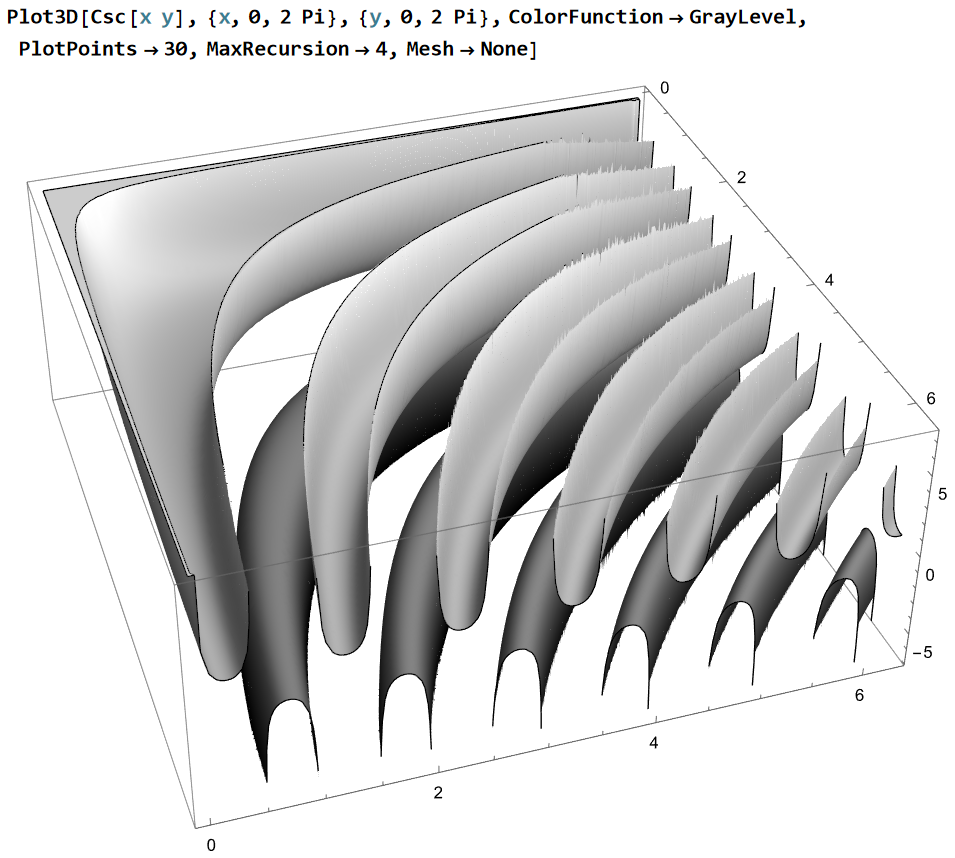
Plot3D[
Csc[x y],
{x, 0, 2 Pi},
{y, 0, 2 Pi},
ColorFunction -> GrayLevel,
PlotPoints -> 30,
MaxRecursion -> 4,
Mesh -> None
]
Fuzz Screen
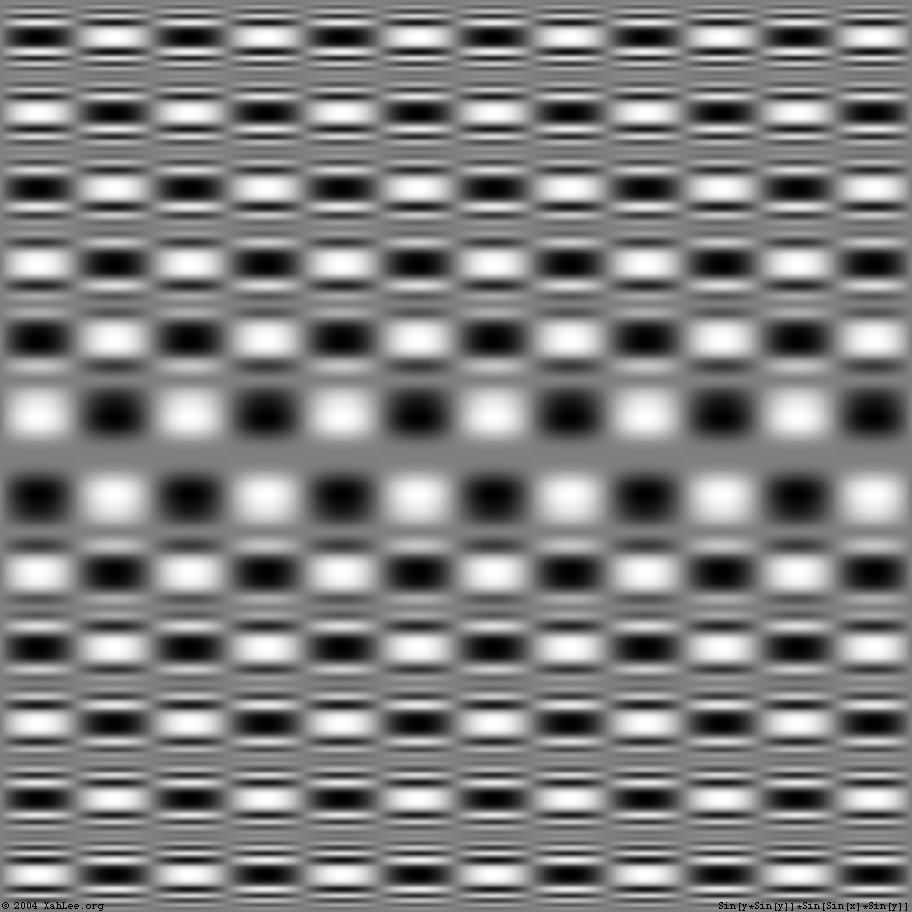
DensityPlot[
Sin[y Sin[y]] Sin[Sin[x] Sin[y]],
{x, -4 Pi, 4 Pi},
{y, -4 Pi, 4 Pi},
ColorFunction -> Function[x, Hue[0, x, 1]],
PlotPoints -> 30,
MaxRecursion -> 4]
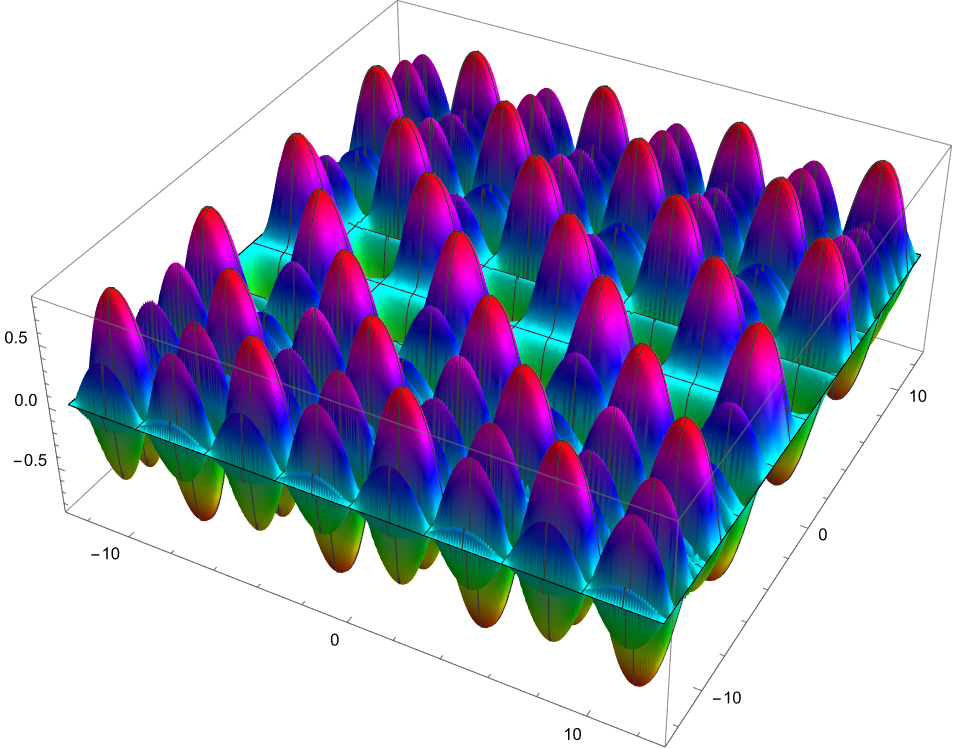
Plot3D[
Sin[y Sin[y]] Sin[Sin[x] Sin[y]],
{x, -4 Pi, 4 Pi},
{y, -4 Pi, 4 Pi},
ColorFunction -> Hue,
PlotPoints -> 30,
MaxRecursion -> 4
]
Sharp Cuts
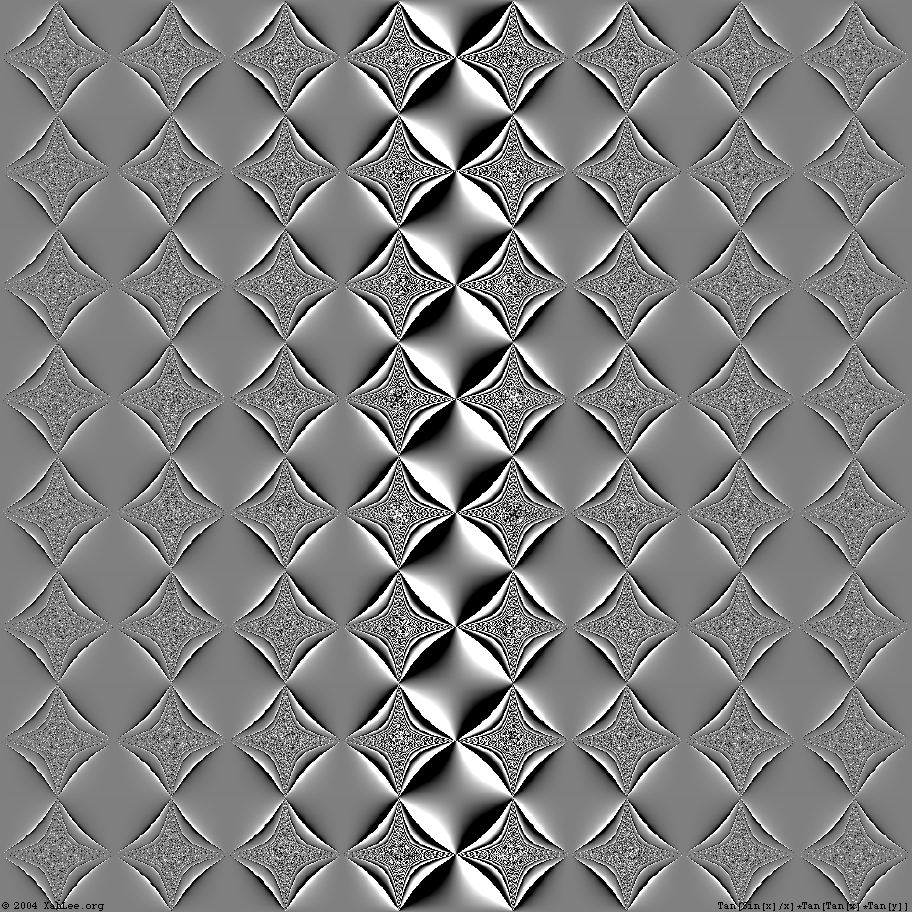
DensityPlot[Tan[ Sin[x]/x] Tan[ Tan[x] Tan[y]]
,{x,10 Pi, - 10 Pi},{y,10 Pi, - 10 Pi}]
Explode Freeze
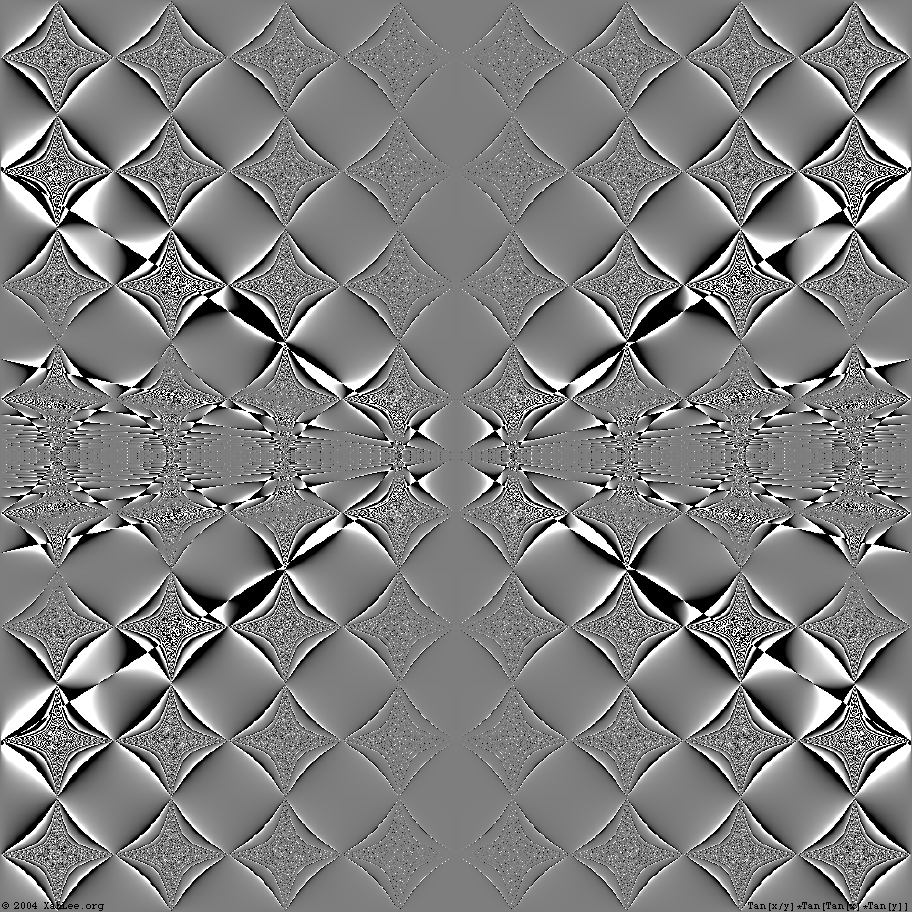
DensityPlot[Tan[ x/y] Tan[ Tan[x] Tan[y]]
,{x,10 Pi, - 10 Pi},{y,10 Pi, - 10 Pi}]
Razor Sharp
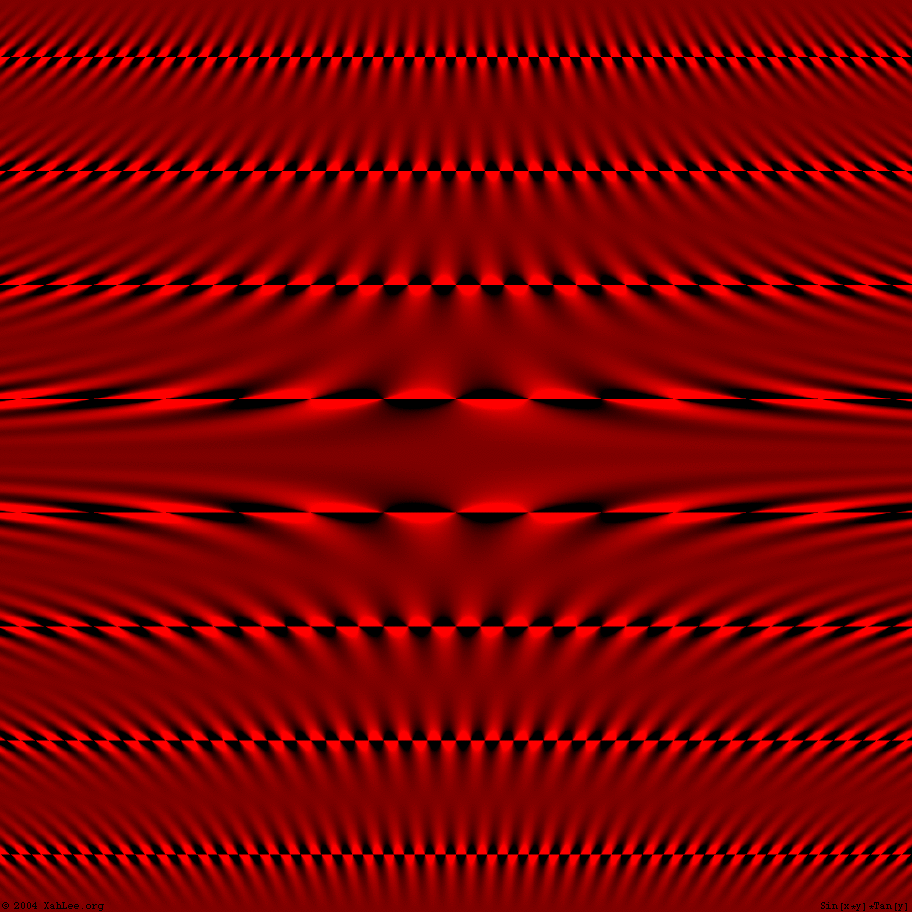
DensityPlot[Sin[x y] Tan[ y ]
,{x,10 Pi, - 10 Pi},{y,10 Pi, - 10 Pi}]
Hyperbolic Wave
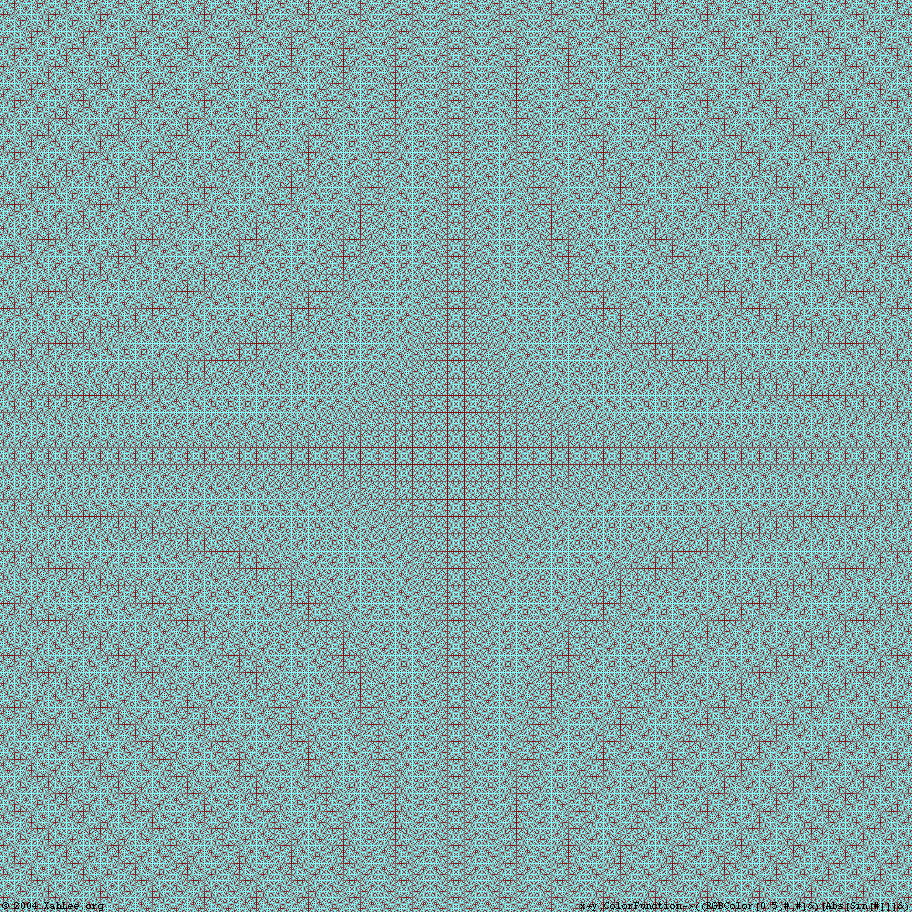
DensityPlot[x y ,{x,10 Pi, - 10 Pi},{y,10 Pi, - 10 Pi}]

(* RGBColor[0.5, Abs[Sin[#]], Abs[Sin[#]]]& *)
Morie