Mandelbrot Set Explained (no complex number needed)
This page gives a easy-to-understand explanation of the Mandelbrot Set fractal without using complex numbers.
Formula
The Mandelbrot Set is defined as follows. Define a function f to be this formula:
f[{a_, b_}] := {a*a - b*b + c1, 2*a*b + c2}
The a, b, c1, c2 are (real) numbers, and c1 and c2 are fixed numbers (constants).
For example, if we set c1=0 and c2=0, then the formula becomes:
f[{a_,b_}] := {a * a - b * b , 2 * a * b}
and then f[{3,4}] evaluates to {-7,24}.
The input is a pair of numbers, and output is also a pair of numbers. You can plot them as points on the plane.
Iteration of Formula
For each point {c1,c2} in the plane, let's compute the recursion (nesting) of
f, starting at the initial input {0,0}. That is, we compute f[f[f[…f[{0,0}]…]]].
Everytime we evaluate f, we get a point. We feed the point back to f, and get another point. We repeat this. If, in the limit, the point gets further and further from the origin {0,0} in a way that it eventually is outside of any circle centered on {0,0} however large, then we say that the number {c1,c2} escapes.
We define the Mandelbrot set as the set of points that do NOT escape.
For example, suppose {c1,c2} is {3,4}. So, the first iteration is to compute f[{0,0}]. We get {3,4}. Then we compute f[{3,4}], we get {-4,28}. Then f[{-4,28}] is {-765,-220}. The sequence we get for first 5 steps this:
{ {3, 4}, {-4, 28}, {-765, -220}, {536828, 336604}, {174882048771, 361396904228}}
By looking at the formula, you can see that it just gets larger and larger. So, the point {3,4} escapes, thus is NOT a member of the Mandelbrot set.
Now, if we set {c1,c2} to be {0.1,0.1}, the first 5 steps is:
{ {0.1, 0.1}, {0.1, 0.12}, {0.0956, 0.124}, {0.0937634, 0.123709}, {0.0934877, 0.123199}}
The first number clearly decreases slowly, but the second number increases slowly. One can prove by basic calculus that if we continue the computation forever, the point does NOT escape, thus {0.1,0.1} is a point in the Mandelbrot set.
Plot of Mandelbrot Set
To plot the set, we have to compute all possible points in the plane (or, at least for points we want to see in our plot). For each point {c1,c2}, we have to compute f infinitely many times. For practical purposes, let's just say we do one thousand steps for each point. If it gets large, we color the point white, otherwise black.
Here's a plot. The black colored region are points in the Mandelbrot set.
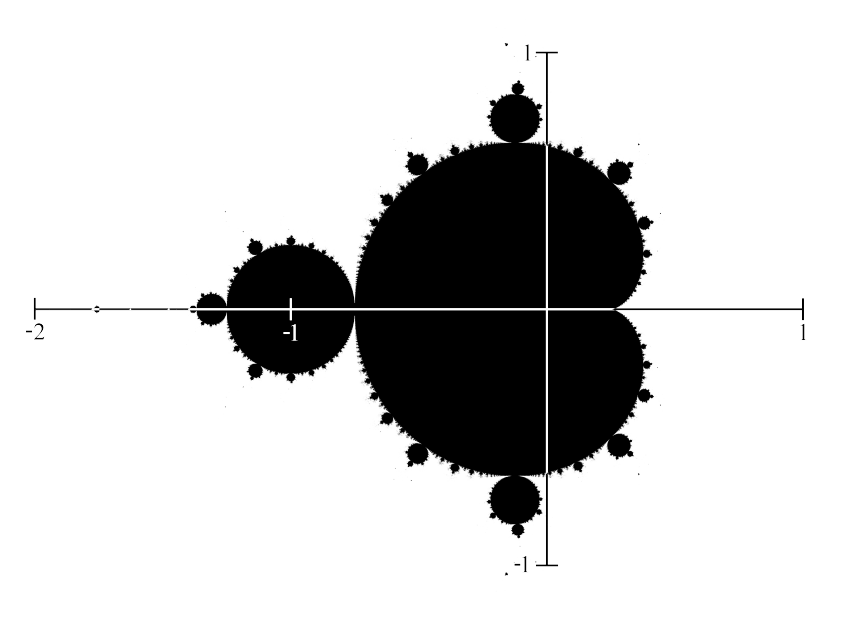
You get this bizarre ass-shaped thing. And, see those weird-looking jagged edges? That's the fascinating aspect about the Mandelbrot set. If you zoom in, you'll see that this weird-looking jagged edge is never smooth no matter what magnification, and the pattern of this ass-shape seem to repeat at random places forever, yet not in some particular predictable ordered fashion.

In the above animation, you can see this weird pattern. The Mandelbrot set is usually plotted with color. A typical coloring scheme (used in the above animation) is to color a point by how fast the point {c1,c2} escapes. (that is, how many iterations of f the point becomes outside of a given circcle.)
The following is another zoom-in animation at a different point. Supposedly it's the deepest zoom-in animation on record. It's computed on a machine with 12 CPU, for 6 months, in 2010.

- https://youtu.be/0jGaio87u3A
- “Deepest Mandelbrot Set Zoom Animation ever — a New Record! 2.1×10^275” By Orson Wang.
Mandelbrot Set Formula with Complex Numbers
The above formula can be expressed in complex numbers. Using complex numbers, the function f is:
f[z_] := z^2+C
For many free software that plots the Mandelbrot set, see: Great Fractal Software .
For a simple explanation of complex numbers, see: Geometric Transformation on the Plane .