JavaScript DOM SVG font-size sucks
when doing computer graphics, the font size, and aspect ratio, and canvas arbitrary resizing, is really a thorny problem. I guess that's why many dvd players in early days can't get aspect ratio right, and css is totally confusing about pixel and length units.
1. xah edu corner, extempore! episode № 20180409172936, on the suckiness of JavaScript DOM SVG font-size problem.
in this posts, i'll explain the problem, in real time. No js dom svg experience required.
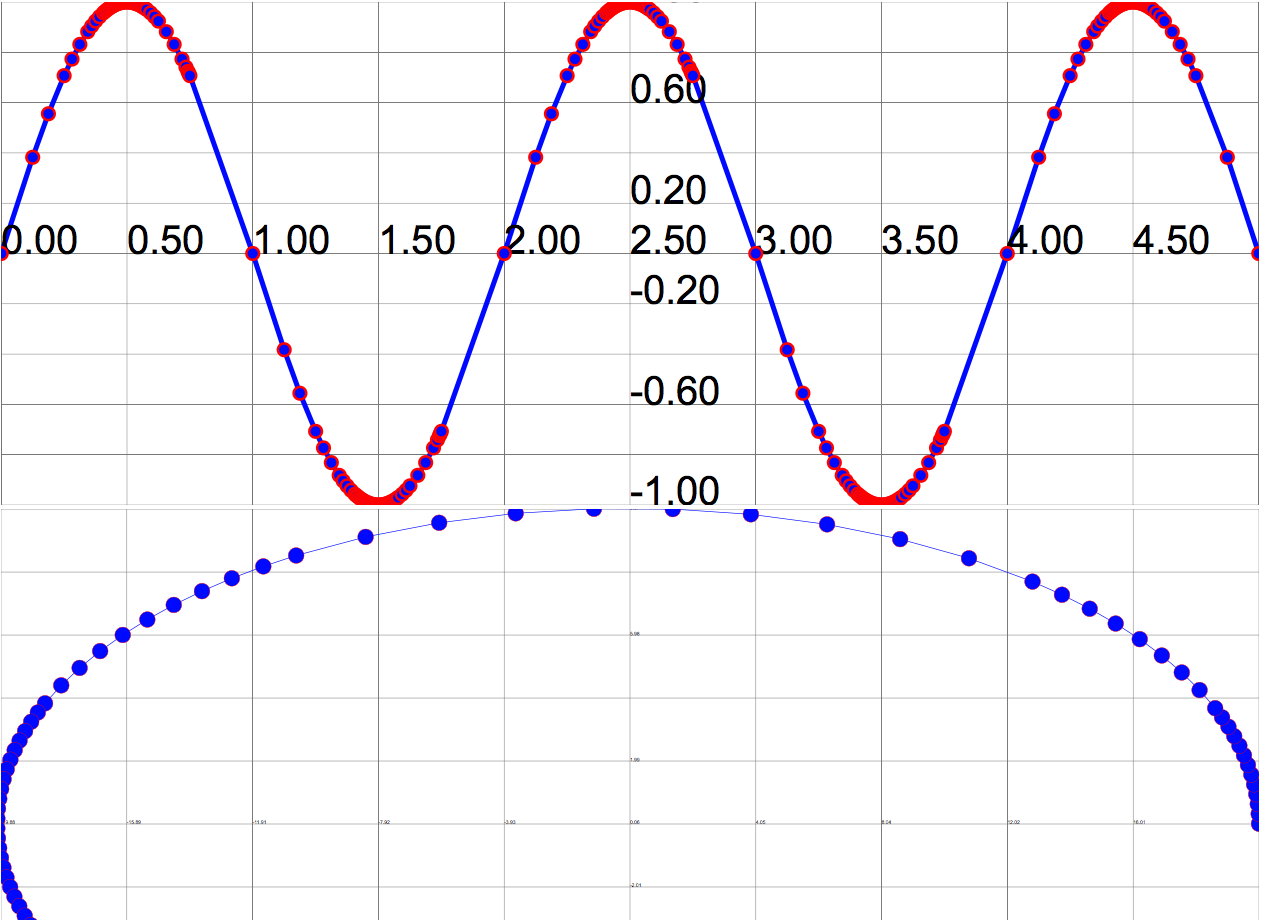
2 say you want to write plot sine in svg. you start a canvas like this:
<svg width="100" height="100">
the x start at 0 on left, and y start at 0 from top.
But you want to plot sin from -5 to 5, and y -1 to 1.
you can see immediately there's aspect ratio problem.
3 besides the aspect ratio problem, you see that on phone or screen, it's silly to hardcode 100x100 canvas. So you have the problem of arbitrary screen size. This variable screen size, and aspect ratio problem, is thorny to solve.
4 very tricky to create a app that works in arbitrary screen dimension and not have ugly blanks or clips (as in viewing old movie on squarish TV) Almost always, any game, dvd player, web app, they “fix it” by using fixed canvas size.
5 for game or movie, the content usually have a fixed aspect ratio. But for plotting math function, the problem is worse. eg sine is rectangular, but you might be plotting a circle (square), or exp function (vertical strip)
6 now, another problem is y reversal. (0,0) is top left, and y goes from top to down. But in math, y is reversed direction. You need a transformation on EVERY POINT OF Y. Mathematically trivial, but is major pain to work with. Note, there is NO WAY, to tell svg use reversed y.
7 now, the problem of coord transformation and scaling.
u want plot sine -5 to 5.
But canvas coord is 0 to 100.
SVG provides user coord, e.g. <svg width="…" height="…" viewBox="xmin ymin xwidth yheight" > So now top left is (xmin ymin) and w h is xwidth yheight.
Nice.
But.
8 so for sine, you might begin with <svg viewBox="-5 -1 5 2" > means, your canvas coord is now from -5 to 5, and y from -1 to 1.
(still reversed dir though) (the actual canvas size is auto determined by browser, like div is.) Nice, but now, font size problem.
9 for font size, you want “default” size, regardless phone or tv screen. e.g. 1rem (or css3 1vw). But svg font size is with respect to user coord (not the actual canvas size). So, 16px may be invisibly or fill screen. in our sine (x,-5,5)(y,-1,1), 16px or 1rem fills screen.
10 you might think just use 1rem somewhere, but with svg, as soon as you are using user coord, whatever the 1rem's actual value gets converted to user coord value. so 1rem just becomes 16px, and in user coord, is invisible or fill screen. What a great pain in the ass.
11 of course, you can solve the font size prob by manually code it. i.e. first find the ratio of user coord dim and the actual dim, then multiply that with 16px to get the right font size value, and use that for every text element.
12 but, how do u find the actual canvas width height? that's another problem. Or, u hard code to specify a width height or aspect ratio. Then, we back to the prob of no arbitrary resizing of canvas. Like, i have 22″ screen, but apps gamps force them to little fixed tiny fucking box.
for tutorial, see:
font related misc articles
- CSS: Font. Index
- Font Size Survey 2023
- Font Size Problem: CSS Size vs Visual Size (2018)
- Serif vs Sans Serif Font (2026)
- Web Design: Serif or Sans-Serif? (2016)
- Unicode Font Comparison: Arial Unicode MS, DejaVu Sans, Lucida Sans Unicode (2011)
- Symbola Font for Unicode No Longer Free (2018)
- How to Install Font
- Linux: How to Install Font, List Fonts
- JavaScript DOM SVG font-size sucks
- SVG: Font Size
- Python Doc Font Size Too Small (2024)
- Windows sucks: Ugly Bitmap Font (2021)
- Windows sucks: Tiny Font
- Linux: Default Fonts
- 2023-04 Xahlee Site Change Font