Xah Talk Show 2025-08-16 Ep693 Xah Wolfram Mode Demo, and Determine Symbol is Function or Option

xah talk show ep693 34087
xah talk show ep693 31594
xah talk show ep693 33e7f
xah talk show ep693 33ea8
ParametricPlot3D[
{Cos[x], Sin[x], t},
{x, 0, 2 Pi 2},
{t, 0, 5}
]

ParametricPlot3D[
{Cos[x], Sin[x], x},
{x, 0, 2 Pi 2}
]

(* HHHH------------------------------ *)

Table[ {x, x^2}, {x, 1, 5}]
(* {{1, 1}, {2, 4}, {3, 9}, {4, 16}, {5, 25}} *)

Table[ x, {x, 1, 5}]
(* {1, 2, 3, 4, 5} *)

Table[ f[x,y], {x, 1, 2}, {y, 1, 3}]
(* 
{
{f[1, 1], f[1, 2], f[1, 3]},
{f[2, 1], f[2, 2], f[2, 3]}
}
 *)

(* HHHH------------------------------ *)

ParametricPlot3D[
{Cos[x], Sin[x], x},
{x, 0, 2 Pi 2},
Background -> Red
]

Options[ParametricPlot3D]

(* 
{AlignmentPoint -> Center,
 AspectRatio -> Automatic,
 AutomaticImageSize -> False,
 Axes -> True,
 AxesEdge -> Automatic,
 AxesLabel -> None,
 AxesOrigin -> Automatic,
 AxesStyle -> {},
 Background -> None,
 BaselinePosition -> Automatic,
 BaseStyle -> {},
 BoundaryStyle -> None,
 Boxed -> True,
 BoxRatios -> Automatic,
 BoxStyle -> {},
 ClipPlanes -> None,
 ClipPlanesStyle -> Automatic,
 ColorFunction -> Automatic,
 ColorFunctionScaling -> True,
 ColorOutput -> Automatic,
 ContentSelectable -> Automatic,
 ControllerLinking -> False,
 ControllerMethod -> Automatic,
 ControllerPath -> Automatic,
 CoordinatesToolOptions -> Automatic,
 DisplayFunction :> $DisplayFunction,
 Epilog -> {},
 Evaluated -> Automatic,
 EvaluationMonitor -> None,
 Exclusions -> Automatic,
 ExclusionsStyle -> None,
 FaceGrids -> None,
 FaceGridsStyle -> {},
 FormatType :> TraditionalForm,
 ImageMargins -> 0.,
 ImagePadding -> All,
 ImageSize -> Automatic,
 ImageSizeRaw -> Automatic,
 LabelingSize -> Automatic,
 LabelStyle -> {},
 Lighting -> Automatic,
 MaxRecursion -> Automatic,
 Mesh -> Automatic,
 MeshFunctions -> Automatic,
 MeshShading -> None,
 MeshStyle -> Automatic,
 Method -> Automatic,
 NormalsFunction -> Automatic,
 PerformanceGoal :> $PerformanceGoal,
 PlotLabel -> None,
 PlotLabels -> None,
 PlotLegends -> None,
 PlotPoints -> Automatic,
 PlotRange -> Automatic,
 PlotRangePadding -> Automatic,
 PlotRegion -> Automatic,
 PlotStyle -> Automatic,
 PlotTheme :> $PlotTheme,
 PreserveImageOptions -> Automatic,
 Prolog -> {},
 RegionFunction -> (True & ),
 RotationAction -> Fit,
 ScalingFunctions -> None,
 SphericalRegion -> Automatic,
 TargetUnits -> Automatic,
 TextureCoordinateFunction -> Automatic,
 TextureCoordinateScaling -> Automatic,
 Ticks -> Automatic,
 TicksStyle -> {},
 TouchscreenAutoZoom -> False,
 ViewAngle -> Automatic,
 ViewCenter -> Automatic,
 ViewMatrix -> Automatic,
 ViewPoint -> {1.3,
 -2.4,
 2.},
 ViewProjection -> Automatic,
 ViewRange -> All,
 ViewVector -> Automatic,
 ViewVertical -> {0,
 0,
 1},
 WorkingPrecision -> MachinePrecision}
 *)
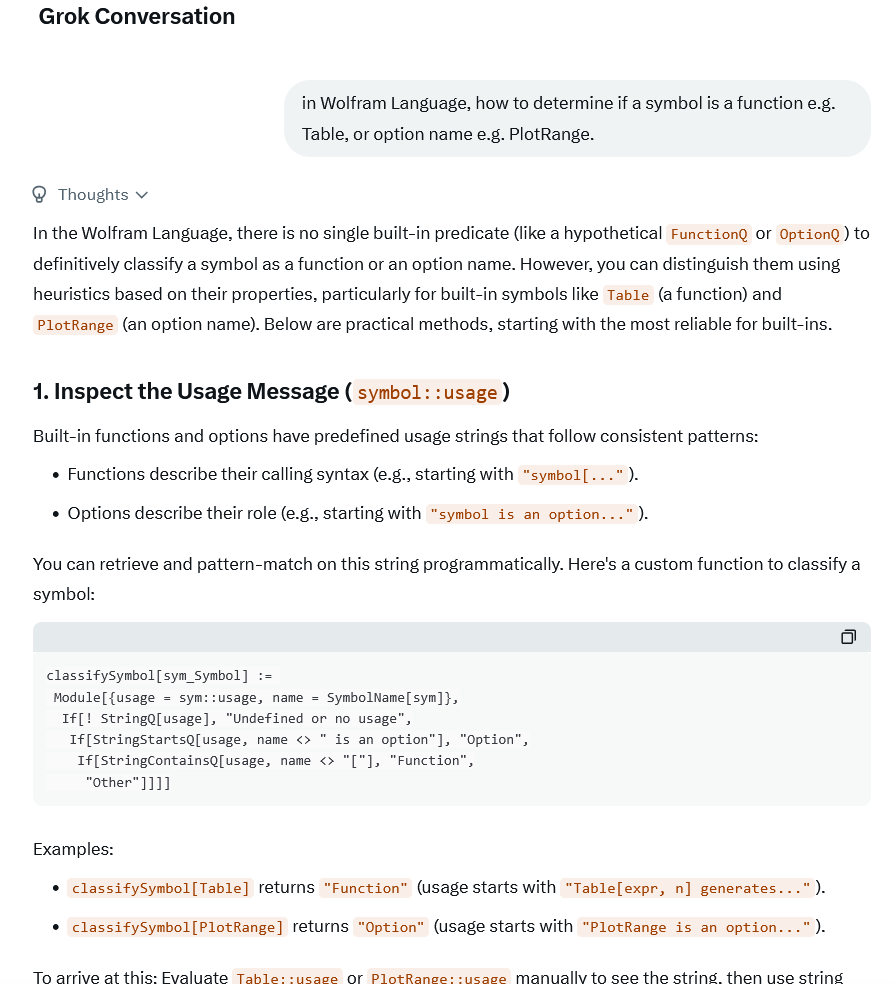
classifySymbol[sym_Symbol] :=
 Module[
{usage = sym::usage,
name = SymbolName[sym]},
  If[! StringQ[usage], "Undefined or no usage",
   If[StringStartsQ[usage, name <> " is an option"], "Option",
    If[StringContainsQ[usage, name <> "["], "Function",
     "Other"]]]

]

(* HHHH------------------------------ *)

Table::usage

"DisplayForm[
RowBox[{Table, [, RowBox[{StyleBox[expr, TI], ,, StyleBox[n, TI]}], ]}]] generates a list of DisplayForm[StyleBox[n, TI]] copies of DisplayForm[StyleBox[expr, TI]].

DisplayForm[RowBox[{Table, [, RowBox[{StyleBox[expr, TI], ,, RowBox[{{, RowBox[{StyleBox[i, TI], ,, SubscriptBox[StyleBox[i, TI], StyleBox[max, TI]]}], }}]}], ]}]] generates a list of the values of DisplayForm[StyleBox[expr, TI]] when DisplayForm[StyleBox[i, TI]] runs from 1 to DisplayForm[SubscriptBox[StyleBox[i, TI], StyleBox[max, TI]]].

DisplayForm[RowBox[{Table, [, RowBox[{StyleBox[expr, TI], ,, RowBox[{{, RowBox[{StyleBox[i, TI], ,, SubscriptBox[StyleBox[i, TI], StyleBox[min, TI]], ,, SubscriptBox[StyleBox[i, TI], StyleBox[max, TI]]}], }}]}], ]}]] starts with DisplayForm[RowBox[{StyleBox[i, TI], =, SubscriptBox[StyleBox[i, TI], StyleBox[min, TI]]}]].

DisplayForm[RowBox[{Table, [, RowBox[{StyleBox[expr, TI], ,, RowBox[{{, RowBox[{StyleBox[i, TI], ,, SubscriptBox[StyleBox[i, TI], StyleBox[min, TI]], ,, SubscriptBox[StyleBox[i, TI], StyleBox[max, TI]], ,, StyleBox[di, TI]}], }}]}], ]}]] uses steps DisplayForm[StyleBox[di, TI]].

DisplayForm[RowBox[{Table, [, RowBox[{StyleBox[expr, TI], ,, RowBox[{{, RowBox[{StyleBox[i, TI], ,, RowBox[{{, RowBox[{SubscriptBox[StyleBox[i, TI], StyleBox[1, TR]], ,, SubscriptBox[StyleBox[i, TI], StyleBox[2, TR]], ,, StyleBox[..., TR]}], }}]}], }}]}], ]}]] uses the successive values DisplayForm[SubscriptBox[StyleBox[i, TI], StyleBox[1, TR]]], DisplayForm[SubscriptBox[StyleBox[i, TI], StyleBox[2, TR]]], ....
DisplayForm[RowBox[{Table, [, RowBox[{StyleBox[expr, TI], ,, RowBox[{{, RowBox[{StyleBox[i, TI], ,, SubscriptBox[StyleBox[i, TI], StyleBox[min, TI]], ,, SubscriptBox[StyleBox[i, TI], StyleBox[max, TI]]}], }}], ,, RowBox[{{, RowBox[{StyleBox[j, TI], ,, SubscriptBox[StyleBox[j, TI], StyleBox[min, TI]], ,, SubscriptBox[StyleBox[j, TI], StyleBox[max, TI]]}], }}], ,, StyleBox[..., TR]}], ]}]] gives a nested list. The list associated with DisplayForm[StyleBox[i, TI]] is outermost."

(* HHHH------------------------------ *)

StringQ[Table::usage]
(* True *)

(* HHHH------------------------------ *)

TextForm[Information[ "Table" ]] // StringQ

StringForm[Information[ "Table" ]] // StringQ
(* False *)

ToString[Information[ "Table" ]] // StringQ
True

ToString[Information[ "Table" ]]

Table[expr, n] generates a list of n copies of expr. Table[expr, {i, i   }] generates a list of the values of expr when i runs from 1 to i   . Table[expr, {i, i   , i   }] starts with i = i   . Table[expr, {i, i   , i   , di}] uses steps di. Table[expr, {i, {i , i , ...}}] uses the successive values i , i , ....Table[expr, {i, i   , i   }, {j, j   , j   }, ...] gives a nested list. The list associated with i is outermost.
                                                                      max                                                                 max                   min   max                    min                   min   max                                        1   2                                   1   2                     min   max        min   max

Attributes[Table]={HoldAll, Protected}

Table[expr, n] generates a list of n copies of expr. Table[expr, {i, i   }] generates a list of the values of expr when i runs from 1 to i   . Table[expr, {i, i   , i   }] starts with i = i   . Table[expr, {i, i   , i   , di}] uses steps di. Table[expr, {i, {i , i , ...}}] uses the successive values i , i , ....Table[expr, {i, i   , i   }, {j, j   , j   }, ...] gives a nested list. The list associated with i is outermost.
                                                                      max                                                                 max                   min   max                    min                   min   max                                        1   2                                     1   2                       min   max        min   max

Attributes[Table]={HoldAll, Protected}

(* HHHH------------------------------ *)
Clear[classifySymbol]

classifySymbol[xsym_Symbol] :=
 Block[
{xdocstr = ToString[Information[ xsym ]],
xname = SymbolName[xsym]},
  If[
! StringQ[xdocstr], "Undefined or no xdocstr",
   If[
     StringStartsQ[xdocstr, xname <> " is an option"], "Option",
      If[ StringContainsQ[xdocstr, xname <> "["], "Function",
     "Other"]]]
]

Map[classifySymbol, Names["*"]]

Map[
Function[x, classifySymbol[Symbol[x]]]
, Names["t*"]]

(* HHHH------------------------------ *)

classifySymbol[Table]
(* Function *)
classifySymbol[Background]
(* Option *)