Xah Talk Show 2022-02-06 Intro to WolframLang Mathematica Graphics and Programing Graphics
 Mathematica 2022-02-06 132903 Y3Vt
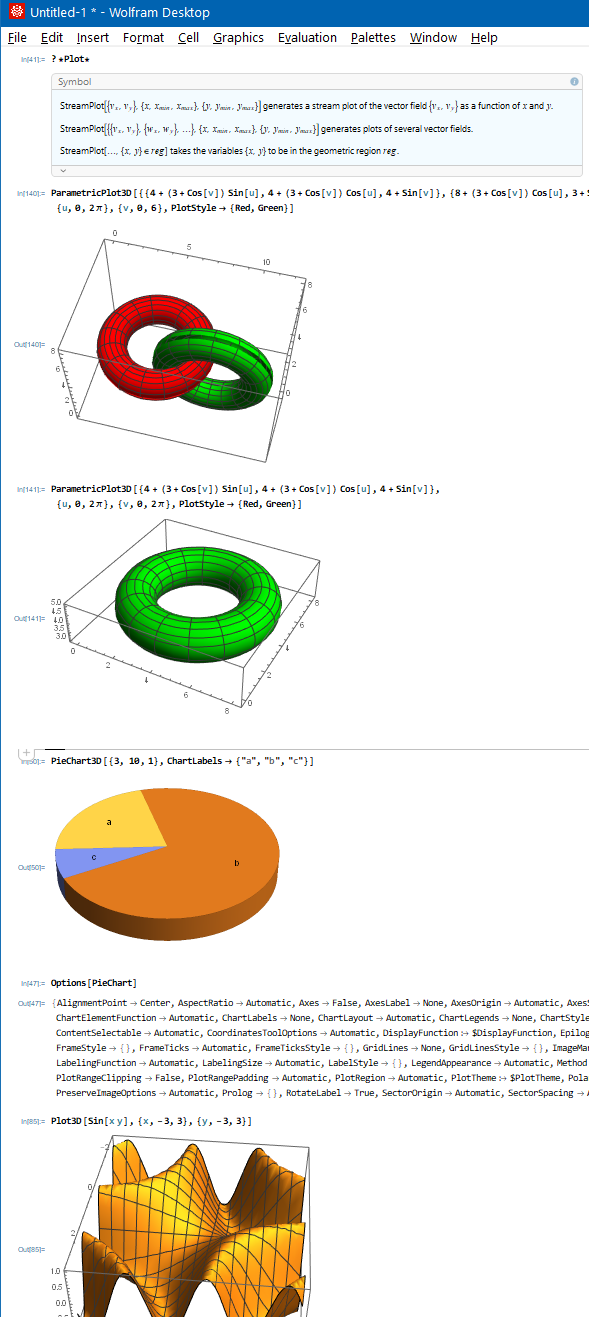
?*Plot*

ParametricPlot3D[{{4 + (3 + Cos[v]) Sin[u], 4 + (3 + Cos[v]) Cos[u],
   4 + Sin[v]}, {8 + (3 + Cos[v]) Cos[u], 3 + Sin[v],
   4 + (3 + Cos[v]) Sin[u]}},
 {u, 0, 2 \[Pi]}, {v, 0, 6}, PlotStyle -> {Red, Green}]

ParametricPlot3D[{4 + (3 + Cos[v]) Sin[u], 4 + (3 + Cos[v]) Cos[u],
  4 + Sin[v]},
 {u, 0, 2 \[Pi]}, {v, 0, 2 \[Pi]}, PlotStyle -> {Red, Green}]

PieChart3D[{3, 10, 1}, ChartLabels -> {"a", "b", "c"}]

Options[PieChart]

Plot3D[Sin[x y], {x, -3, 3}, {y, -3, 3}]

StreamPlot[{{x + y, y - x}, {y, x + y}}, {x, -3, 3}, {y, -3, 3}]

?PlotLayout

GraphPlot[ExampleData[{"Matrix", "Bai/dwa512"}, "Matrix"]]

GraphPlot3D[ExampleData[{"Matrix", "Bai/dwa512"}, "Matrix"]]

ExampleData[{"Matrix", "Bai/dwa512"}, "Matrix"]

Normalize@ExampleData[{"Matrix", "Bai/dwa512"}, "Matrix"]
 Mathematica 2022-02-06 132604 MBy5
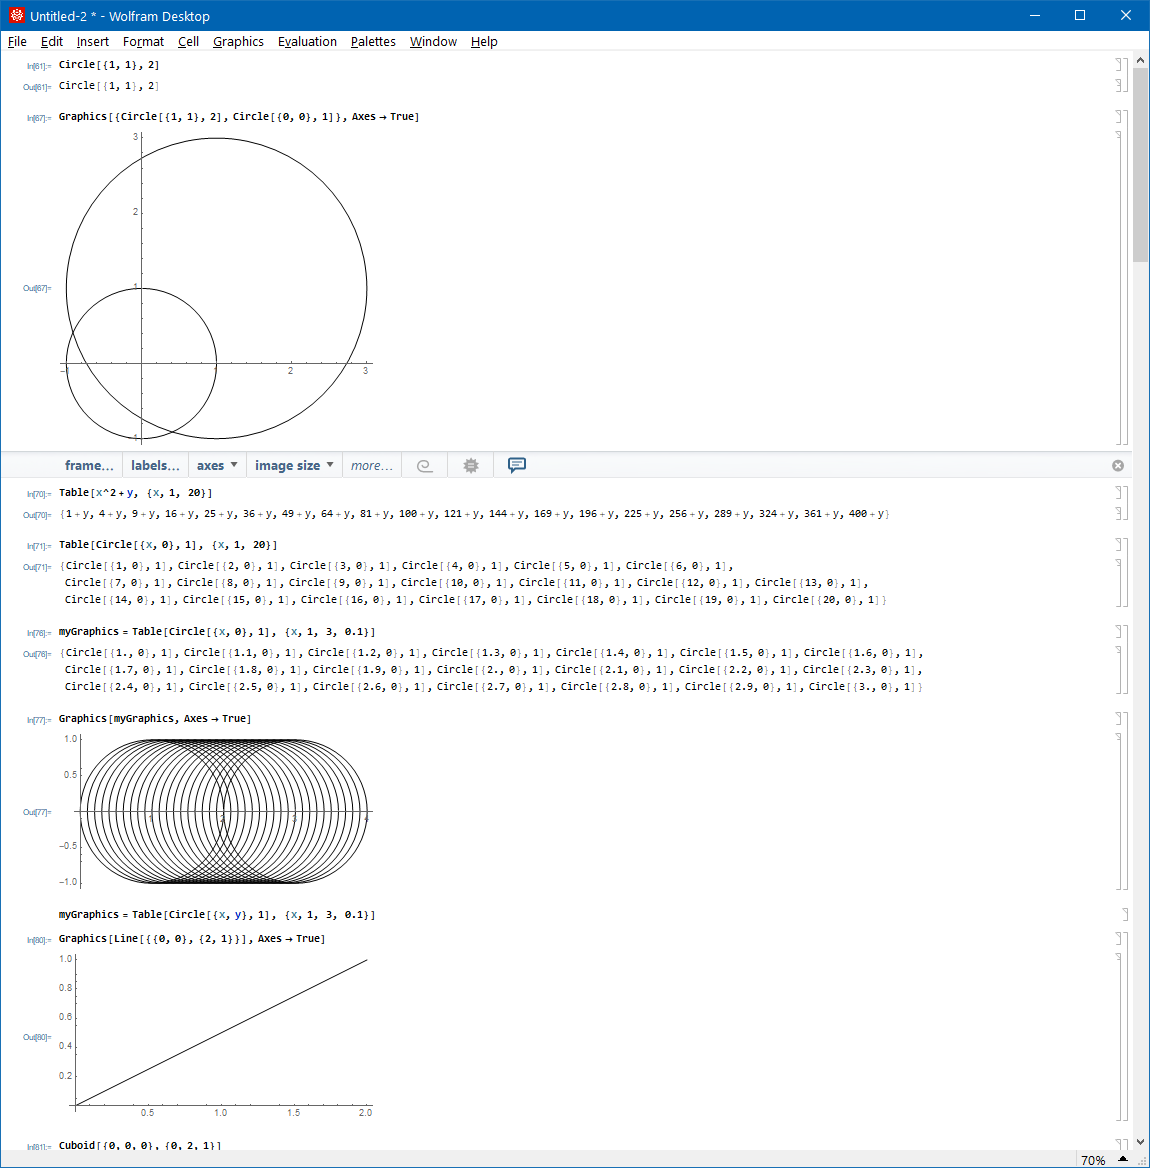
Circle[{1, 1}, 2]

Graphics[{Circle[{1, 1}, 2], Circle[{0, 0}, 1]}, Axes -> True]

Table[x^2 + y, {x, 1, 20}]

Table[Circle[{x, 0}, 1], {x, 1, 20}]

myGraphics = Table[Circle[{x, 0}, 1], {x, 1, 3, 0.1}]

Graphics[myGraphics, Axes -> True]

myGraphics = Table[Circle[{x, y}, 1], {x, 1, 3, 0.1}]

Graphics[Line[{{0, 0}, {2, 1}}], Axes -> True]

Cuboid[{0, 0, 0}, {0, 2, 1}]

Graphics3D[Cuboid[{0, 0, 0}, {3, 2, 4}]]

Plot[Sin[x], {x, 1, 10}]

Table[Sin[x], {x, 1, 10, 0.3}] // N

ListPlot[Table[Sin[x], {x, 1, 10, 0.3}] // N]

ListLinePlot[Table[Sin[x], {x, 1, 10, 0.3}] // N]

data = Table[Sin[x], {x, 1, 10, 0.5}]

data = Table[ {x, Sin[x]}, {x, 1, 10, 0.5}]

data

Line@data

Graphics[Line[{{1.`, 0.8414709848078965`}, {1.5`,
    0.9974949866040544`}, {2.`, 0.9092974268256817`}, {2.5`,
    0.5984721441039564`}, {3.`,
    0.1411200080598672`}, {3.5`, -0.35078322768961984`}, {4.`, \
-0.7568024953079282`}, {4.5`, -0.977530117665097`}, {5.`, \
-0.9589242746631385`}, {5.5`, -0.7055403255703919`}, {6.`, \
-0.27941549819892586`}, {6.5`, 0.21511998808781552`}, {7.`,
    0.6569865987187891`}, {7.5`, 0.9379999767747389`}, {8.`,
    0.9893582466233818`}, {8.5`, 0.7984871126234903`}, {9.`,
    0.4121184852417566`}, {9.5`, -0.0751511204618093`}, {10.`, \
-0.5440211108893698`}}]]

Graphics[Line@Table[ {x, Sin[x]}, {x, 1, 10, 0.2}]]

Plot[Sin[x], {x, 1, 10}, PlotPoints -> 5, MaxRecursion -> 0]

Plot[Sin[x], {x, 1, 10}, PlotPoints -> 10, MaxRecursion -> 0]

Plot[Sin[x], {x, 1, 10}, PlotPoints -> 20, MaxRecursion -> 0]

Plot[Sin[x], {x, 1, 10}, PlotPoints -> 200, MaxRecursion -> 0]

Options[Plot]
 Mathematica 2022-02-06 133058 h8bw
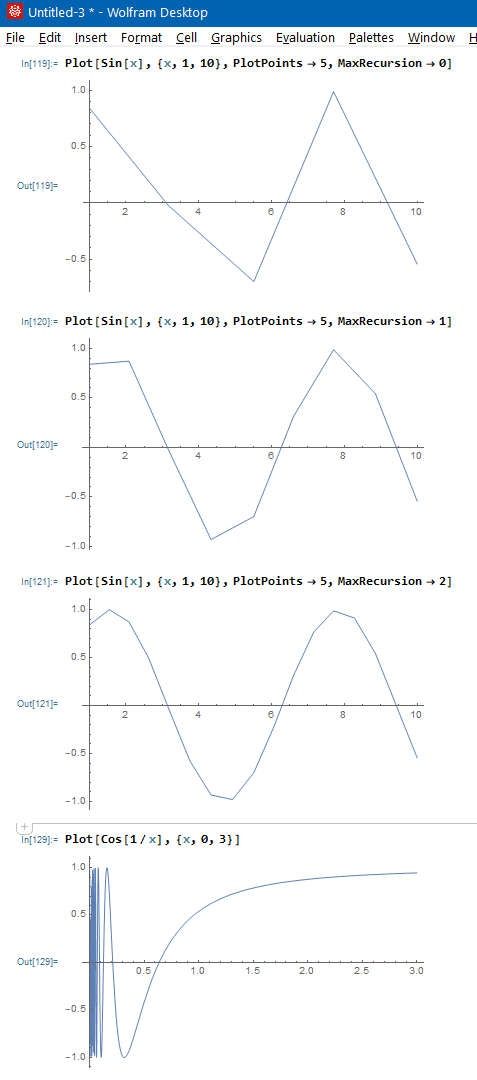
Plot[Sin[x], {x, 1, 10}, PlotPoints -> 5, MaxRecursion -> 0]

Plot[Sin[x], {x, 1, 10}, PlotPoints -> 5, MaxRecursion -> 1]

Plot[Sin[x], {x, 1, 10}, PlotPoints -> 5, MaxRecursion -> 2]

Plot[Cos[1/x], {x, 0, 3}]
 Mathematica 2022-02-06 133222 hp7P
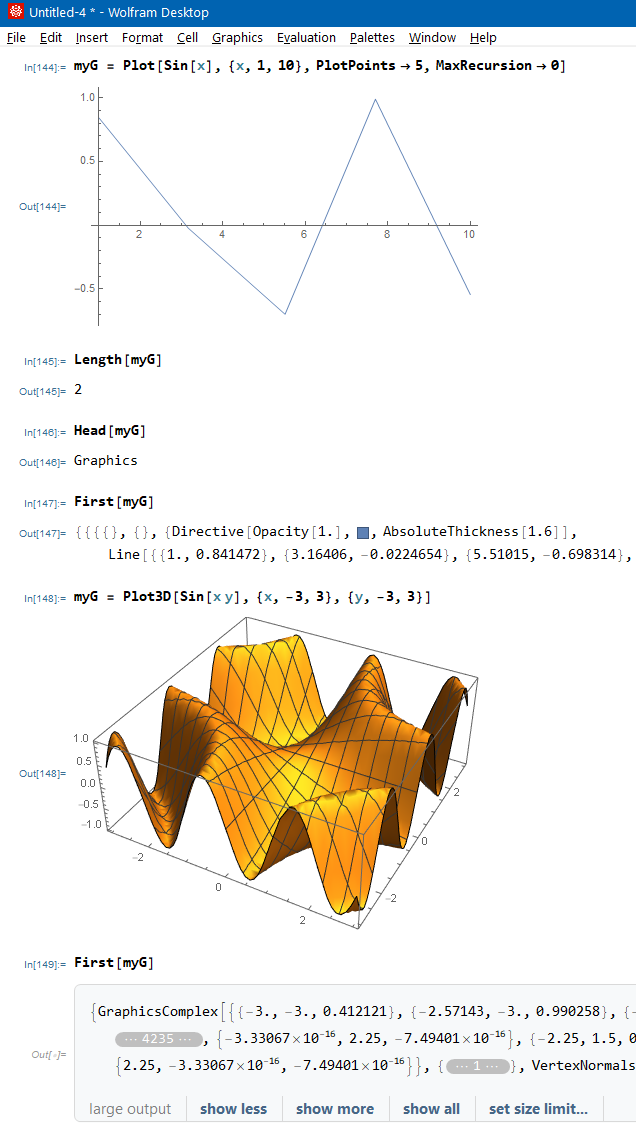
myG = Plot[Sin[x], {x, 1, 10}, PlotPoints -> 5, MaxRecursion -> 0]

Length[myG]

Head[myG]

First[myG]

myG = Plot3D[Sin[x y], {x, -3, 3}, {y, -3, 3}]

First[myG]
- https://anaconda.org/anaconda/python
xah_talk_show_2022-02-06.txt