Xah Talk Show 2025-04-08 Ep640 Wolfram Language, Coding Graphics Function Negative Pedal
 xah talk show 2025-04-09 2ca45
 xah talk show 2025-04-09 Wolfram language 1eaaa
Clear[NegativePedalPlot]
NegativePedalPlot::usage =
"NegativePedalPlot[{xf,yf}, {min, max, step}, {x0, y0}]
Draws the negative pedal lines of the parametric curve {xf,yf} at points from min to max with step
xf and yf must be pure functions with head Function.
Example:
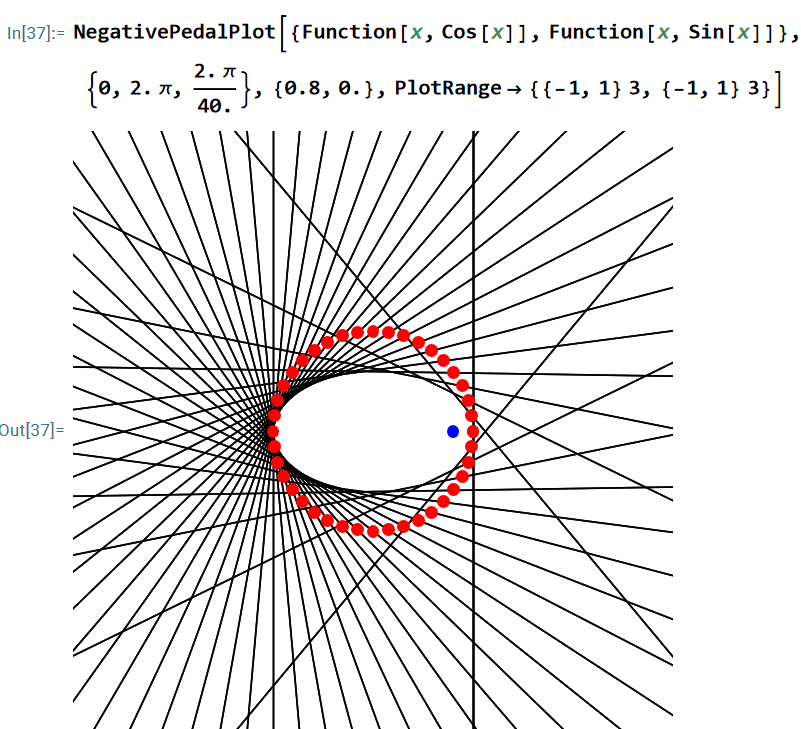
NegativePedalPlot[ {Function[x, Cos[x]], Function[x, Sin[x]]}, {0, 2.*Pi, (2.*Pi)/40.}, {0.8, 0.}, PlotRange -> {{-1, 1}*3, {-1, 1}*3}]";
NegativePedalPlot[{xf_Function, yf_Function}, {tmin_, tmax_, dt_}, {a_, b_}, opts___Rule] :=
Module[{curvePoints, curvePointsGP, pedalPointGP, linesToCurveGP,
negativePedalLinesGP},
curvePoints =
Map[Function[x, {xf[x], yf[x]}], Range[tmin, tmax, dt]];
curvePointsGP =
Map[Function[{Red, PointSize[.02], Point[#]}], curvePoints];
pedalPointGP = {Blue, PointSize[.02], Point[{a, b}]};
linesToCurveGP = Map[Function[Line[{{a, b}, #}]], curvePoints];
negativePedalLinesGP =
Map[Function[
Line[{100 Reverse[
Normalize[# - {a, b}] {1, -1}] + #, -100 Reverse[
Normalize[# - {a, b}] {1, -1}] + #}]], curvePoints];
Graphics[{negativePedalLinesGP, curvePointsGP, pedalPointGP}, opts]]
NegativePedalPlot[
{ Function[{x}, x], Function[{x}, x^2/4 ] },
{-7, 7, .25},
{0, 1},
Axes -> True, AspectRatio -> Automatic,
PlotRange -> {{-7, 7}, {-1, 18}}]