Parabola
History
Description
Parabola is a member of conic sections, along with hyperbola and ellipse. Parabola can be thought of as a limiting case of ellipse or hyperbola.
Note that parabola is NOT a family of curves. The impression that some parabola are more curved is because we are looking at different scale of the curve. Similarly, part of a large circle appears to be a line may induce us to conclude that there are different shapes of circles.
Like ellipse and hyperbola, there are many ways to define parabola. A common definition defines it as the locus of points P such that the distance from a line (called the directrix) to P is equal to the distance from P to a fixed point F (called the focus). As a conic section, the eccentricity of Parabola is 1.
Needs["PlaneCurveGenerator`"]

ListAnimate @ ParabolaGenerator[ {-4.5,2.5}, PlotRange->{{-4.8,5.1},{-1.2,4.8}}, Axes->False, Epilog->{Text["Focus", {0,1},{1.5,-1}], Text["Directrix", {-3,-1}, {0,-1}] } ]
The axis of a parabola is a line perpendicular to its directrix and passing its focus. Vertex of the parabola is the intersection of the parabola and its axis.
Formula
Parametric Equation
ParametricPlot[ {t, 1/4 t^2}, { t, -5, 5} ]
- Vertex at {0,0}
- Focus at {0,1}
the parameter t goes from -Infinity to Infinity
Cartesian Equation
ContourPlot[ y == 1/4 x^2 , {x, -5, 5}, {y, -5, 5}]
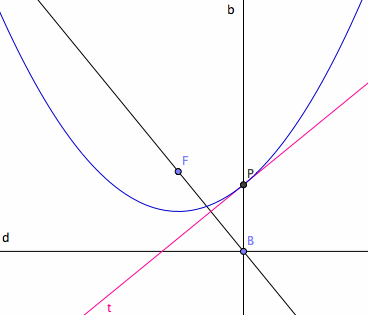
Point and Tangent Construction
Let F be a given point and d be a give line. Let B := Point[d]. Let t := LineBisector[B,F]. Let b := Perpendicular[B,d]. Let P := Intersect[b,t] Since length[segment[B,P]]==length[segment[P,F]], P is a point on parabola. Further, t is the tangent at P.
Invariant under certain Dilation
Parabola have the property that when scaled (streching/shrinking) along a direction parallel or perpendicular to its axis, the curve remain unchanged. (For example, line also have this property, but circle do not. A streched line is still a line, but a streched circle is no longer a circle) When a parabola is streched along the directrix “a” units and along the axis by “b” units, the resulting curve is the original parabola scaled in both direction by “a^2/b”.
Given a parametrization of a parabola {xf[t], yf[t]} with vertex at Origin and focus along the y-axis, its focus is {0, xf[t]^2/(4 yf[t]) }.
Optical Property
A radiant point at the focus will reflect off the parabola into parallel lines. The figure shows three parabolas, two of which share a common focus.
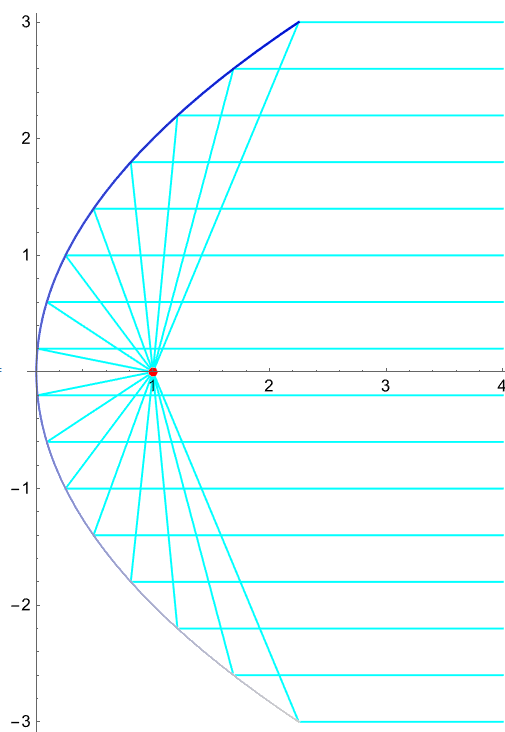
Needs[ "PlaneCurvePlot`" ]

PlaneCurvePlot[ {1/4 t^2, t}, {t, -3, 3, .4},
CausticLineLength -> 5,
CausticOrigin -> {1, 0},
PlotRange -> All,
PlotDot -> False,
AspectRatio -> Automatic]

xx = Table[PlaneCurvePlot[{1/4  t^2, t}, {t, -3, 3, .2},
   CausticLineLength -> 20, CausticOrigin -> {x, 0},
   PlotRange -> {{0, 7}, {-1, 1}  3}, PlotDot -> False,
   AspectRatio -> Automatic], {x, 0.5, 3, 0.1}]

ListAnimate@ xx

3 Parabolas Sharing Reflection Rays
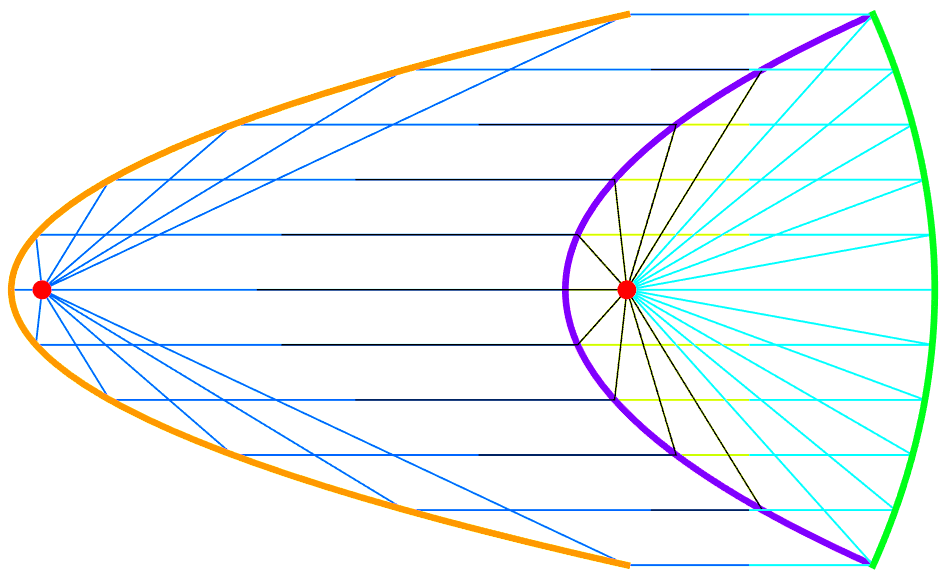
Needs["PlaneCurvePlot`"]

Clear[parabola1, parabola2, parabola2LinesGP, parabola3]

parabola1 =
 ParaPlot[
  RotationTransform[ -(Pi/2)]@{t, t^2/2} + {-10, 0},
  {t, -Sqrt[20], Sqrt[ 20], (2 Sqrt[20])/10},
  CausticLineLength -> 13,
  CausticOrigin -> {-10 + 1/2, 0}, PlotDot -> False,
  CausticLineStyle -> {{Hue[0.6], Thickness[0.002]}},
  CurveColorFunction -> Function[Hue[0.1]],
  CurveStyle -> {Thickness[0.007]}]

parabola2 =
ParaPlot[
  RotationTransform[ -(Pi/2)] @ {t, 1/4 t^2} + {-1, 0},
 {t, -Sqrt[20], Sqrt[ 20]}, Range[-Sqrt[20] + (2 Sqrt[20])/10, Sqrt[20] - (2 Sqrt[20])/10, (2 Sqrt[20])/10.],
  CausticLineLength -> 4, CausticOrigin -> {0, 0}, PlotDot -> False,
  CurveColorFunction -> Function[Hue[0.75]],
  CurveStyle -> {Thickness[0.007]},
  CausticLineStyle -> {{Hue[0.2], Thickness[0.002]}}
  ]

parabola2LinesGP =
 ParaPlot[
RotationTransform[ -(Pi/2)] @ {t, 1/4 t^2} + {-1, 0},
{t, -Sqrt[20], Sqrt[ 20], (2 Sqrt[20])/10}, CausticLineLength -> -6,
  CausticOrigin -> {0, 0}, PlotDot -> False, PlotCurve -> False
]

parabola2LinesGP = Cases[parabola2LinesGP, Line[__], -1]

parabola3 =
  ParaPlot[
  RotationTransform[ Pi/2] @ {t, t^2/20} + {5, 0},
 {t, -Sqrt[20], Sqrt[20], ( 2 Sqrt[20])/10}, CausticLineLength -> 8, CausticOrigin -> {0, 0},
  PlotDot -> False, CurveColorFunction -> Function[Hue[0.35]],
  CurveStyle -> {Thickness[0.007]},
  CausticLineStyle -> {{Hue[0.5, 1, 1], Thickness[0.002]}}
  ]

Show[
{ Graphics @ First @ parabola1, Graphics @ First @ parabola2, Graphics @ parabola2LinesGP, Graphics @ First @ parabola3 }
]
Tangents of Probala
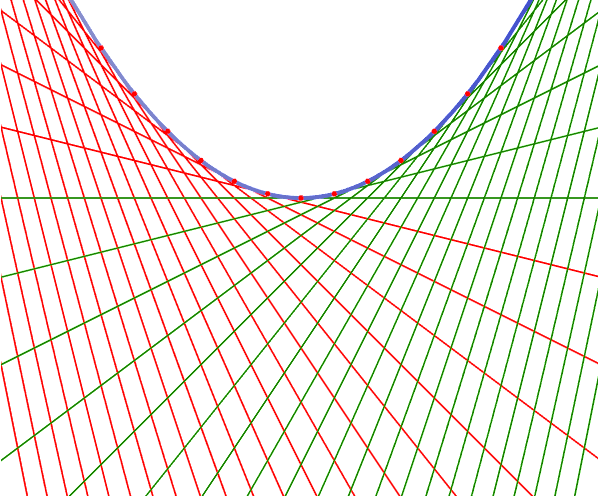
Any set of tangents on the parabola will always cut a arbitrary tangent into the same proportion.
- suppose you pick three tangents call them a, b, c.
- Now pick a arbitrary tangent x.
- Tagents a, b, c will cut x into segments with certain proportions.
- Now pick any other tangent x1, it will be cut into the same proportions.
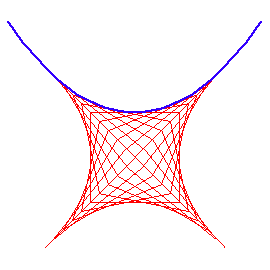
Thus, the envelope of lines with a positive constant sum of intercepts is a segment of parabola.

Needs[ "PlaneCurvePlot`" ]

PlaneCurvePlot[ {t, 1/4 t^2} , {t,-5,5},
Join[{-2.5, -1, 0.},{1.2,  2., 2.5, 3., 3.8}],
TangentLineLength->20,
PlotRange->{{-1,1} 4,{-3,4}},
PlotDot->True,
Axes->False,
CurveStyle->{Thickness[.002]},
CurveColorFunction->Black,
TangentLineStyle->Join[ Table[ Red, {3}], Table[ Green, {8}] ] ]
Needs[ "PlaneCurvePlot`" ]

PlaneCurvePlot[
{t, 1/4 t^2}  , {t,-10,10,.5},
TangentLineLength->100,
PlotRange->{{-1,1} 3,{-3,2}} 1.5,
PlotDot->True, CurveStyle->{Thickness[.007]},
TangentLineStyle-> Join[
Table[ Hue[0], {20}],
Table[ Hue[.3,1,.5], {21}]
],
Axes->False
]
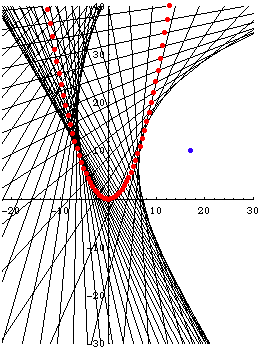
Evolute and Semicubic Parabola
The evolute of a parabola is the semicubic parabola .
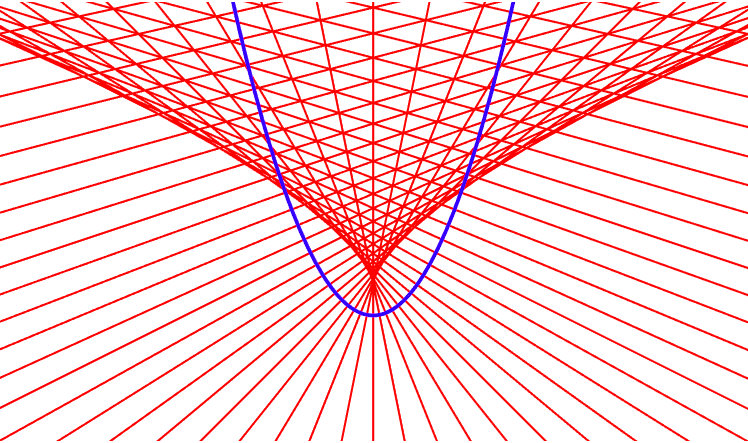
Needs[ "PlaneCurvePlot`" ]

ParaPlot[ {t, 1/4 t^2} , {t, -12, 12, 24/60},
NormalLineLength->100,
NormalLineStyle->Red,
CurveColorFunction->Blue,
PlotDot->False, AspectRatio->Automatic,
PlotRange->{{-24,24},{-8,20}},
Axes->False
]
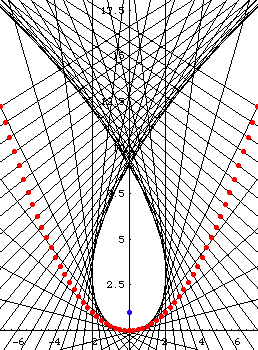
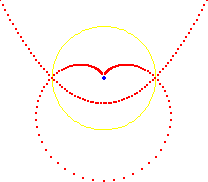
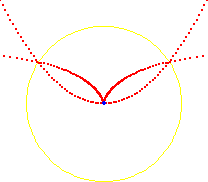
Pedal
The pedal of a parabola with respect to its focus is a line

pedal with respect to its vertex is the cissoid of Diocles.

Needs[ "PlaneCurvePlot`" ]

PlaneCurvePlot[
{t, 1/4 t^2} ,
 {t, -9, 9, .5},
PedalPoint -> {0, 0},
AspectRatio -> Automatic,
PlotRange -> {{-1, 1} 4, {-1.1, 3}}]

PlaneCurvePlot[ {t, 1/4 t^2} ,{t, -8, 8, .5},
PedalPoint->{0,1},
PlotCurve->True,
PlotDot->True,
AspectRatio->Automatic,
PlotRange->{{-1, 1} 4,{-1.1,3}}
]
Inversion
Misc
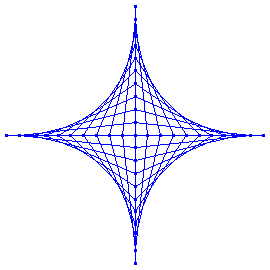
[string_art_square.mov]
string_art_movie.nb