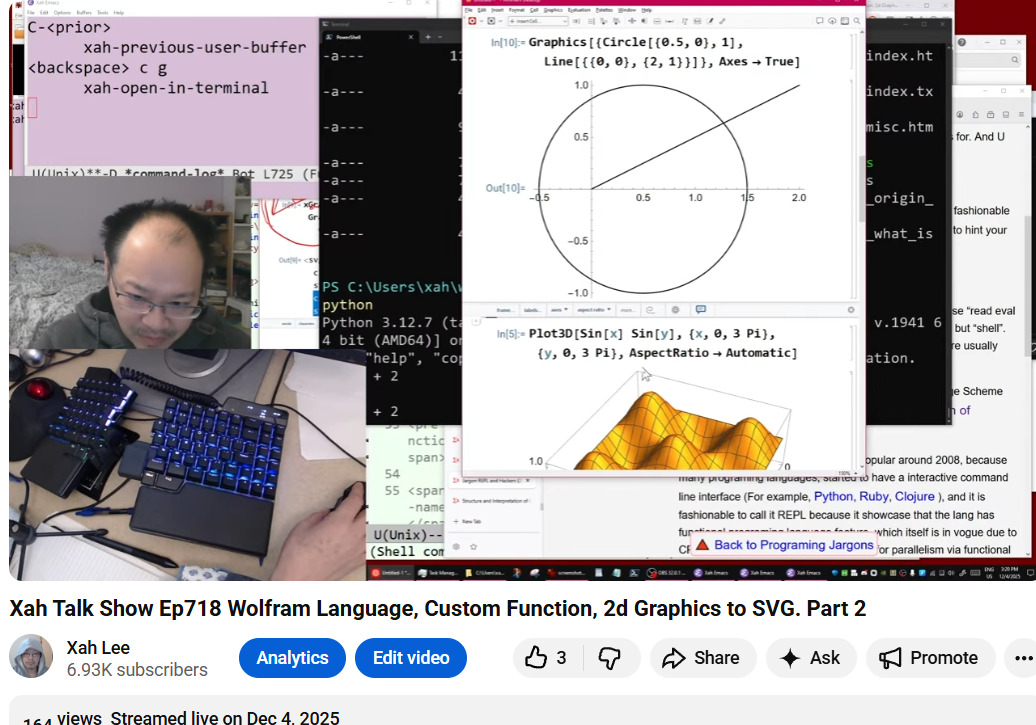
Xah Talk Show 2025-12-04 Ep718 Wolfram Language, Custom Function, 2d Graphics to SVG. Part 2
Video Summary (Generated by AI, Edited by Human.)
This video is the second part of a series focusing on writing a custom Wolfram Language function to convert Wolfram Language graphics to SVG.
Here's a summary of what's covered:
- The creator demonstrates how to define and use Wolfram Language functions, specifically showing how to create graphics using primitives like Circle and Line (4:29, 56:00).
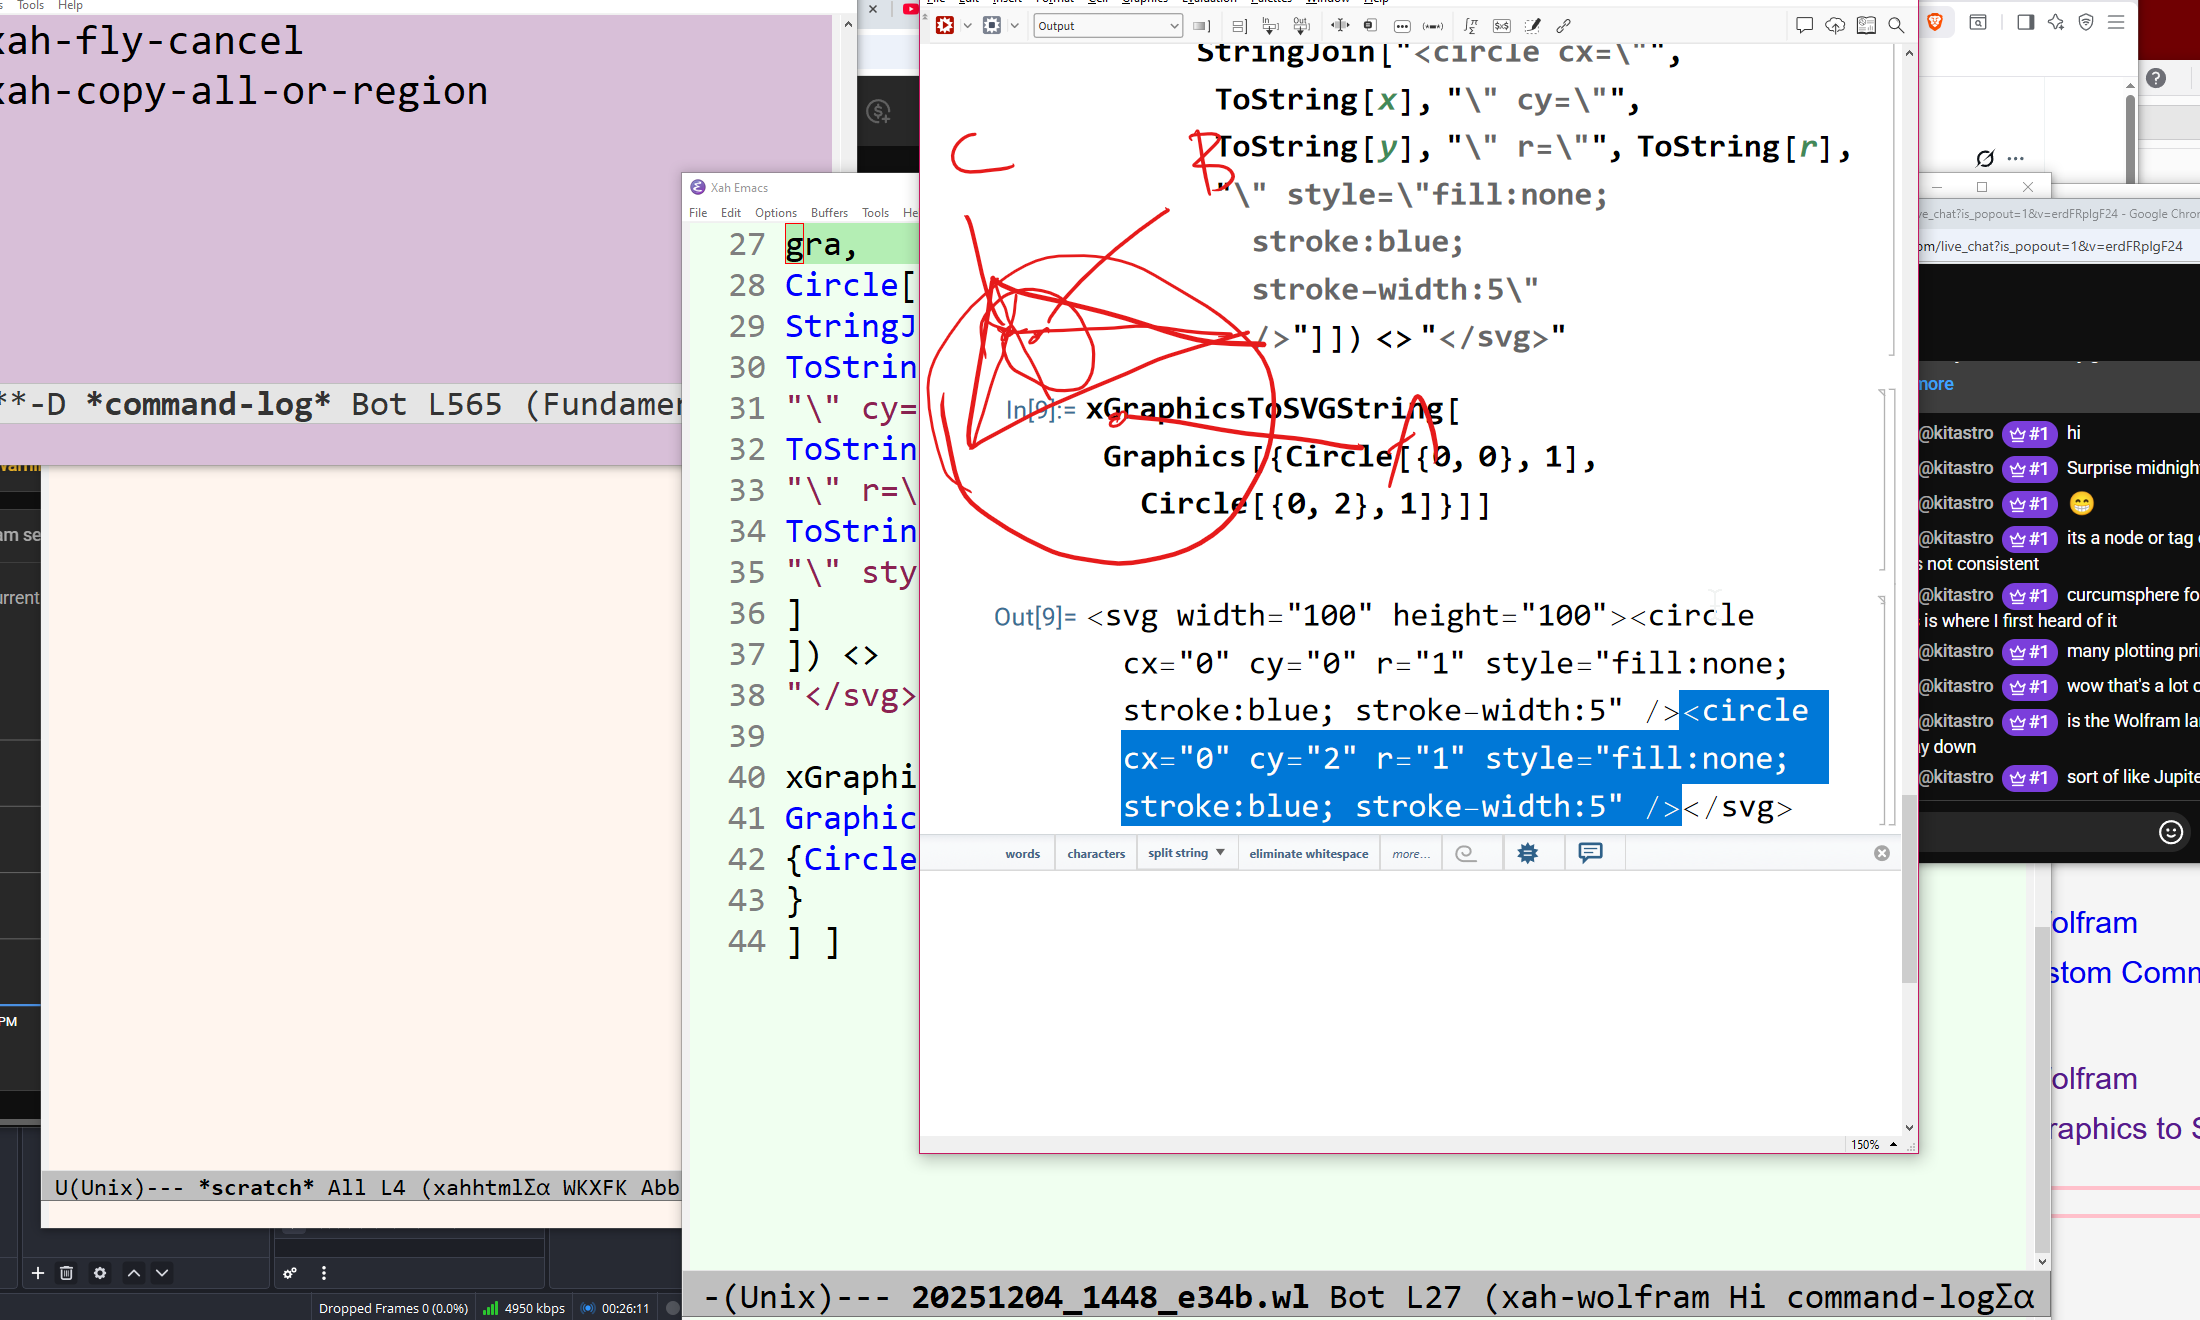
- The core of the video involves enhancing a previously written function called graphicsToSVGString to convert both Circle and Line graphic primitives into their corresponding SVG string representations (15:57, 56:00).
- A significant portion of the video discusses Wolfram Language's computational model, emphasizing its basis in pattern matching and term rewriting systems (26:59). This is contrasted with other programming language models.
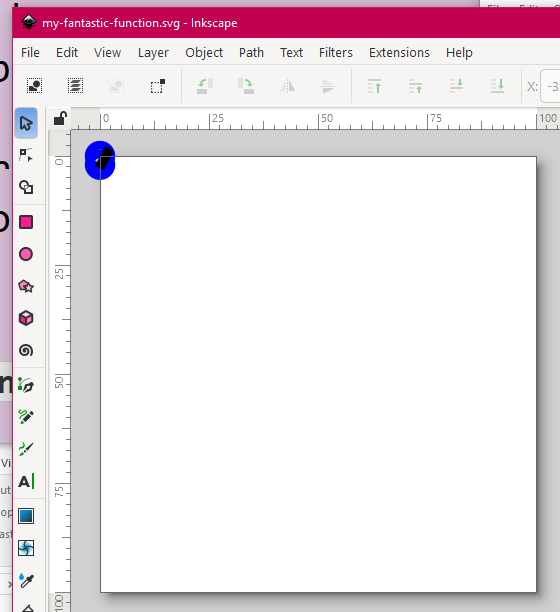
- The creator then modifies the function to save the generated SVG string directly to a file, demonstrating the WriteString function (1:00:37).
- Finally, the video touches upon the challenges of converting Wolfram Language coordinates to SVG coordinates, including issues with origin centering, y-axis reversal, and the need for coordinate rescaling using SVG's viewBox (1:13:25).
The video discusses different "centers" of a triangle, which are specific points within or related to a triangle. The speaker mentions the following:
- Circumcircle/Circumcenter (23:29): A circle that passes through all three vertices of a triangle. The center of this circle is the circumcenter.
- Inscribed Circle/Incenter (24:27): A circle of maximum size that fits inside a triangle, touching all three sides. The center of this circle is the incenter. The incenter is also described as the point where the three interior angle bisectors intersect (33:51).
- Other Centers: The video briefly touches on other centers like the centroid (34:42) and orthocenter (34:49). These are mentioned as part of a broader concept of "so-called centers" in geometry.
The video discusses the concept and history of notebooks, particularly in the context of the Wolfram Language.
- Origin: The speaker states that Wolfram Language (Mathematica) invented the notebook interface in 1989, making it the first of its kind (32:55).
- Jupyter Notebook: Jupyter Notebook is mentioned as a popular example that copied the Wolfram Language's notebook idea (33:01, 37:47).
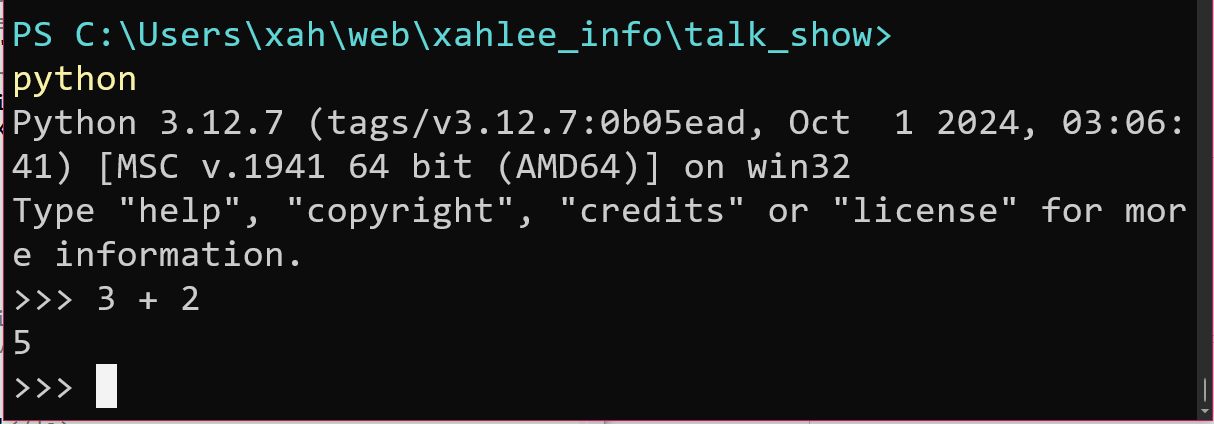
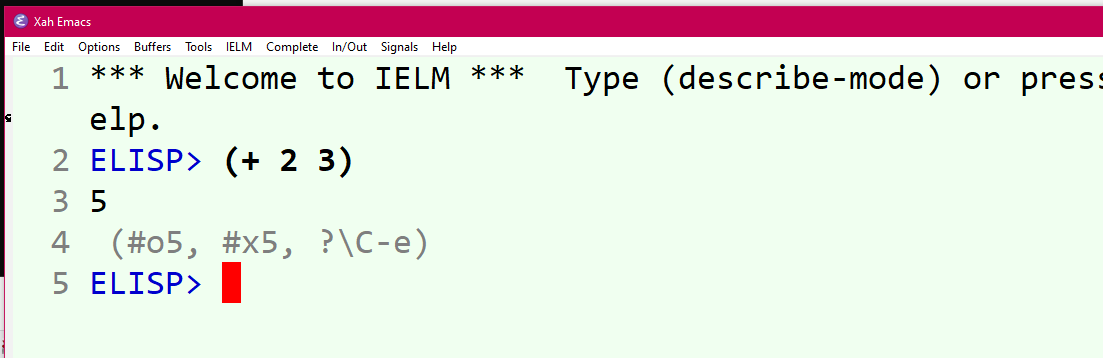
- Advantages over Command Line/REPL: The speaker emphasizes that the notebook interface is superior to a command-line interface (CLI) or a "REPL" (Read-Eval-Print Loop) (47:09). Notebooks allow you to jump to and modify any part of the code at any time, unlike CLIs which are linear and force you into sequential input/output (47:09-47:45).
- Features: Notebooks can include features like headers, sections, bold/italic formatting, and automatic formatting/indentation of code (38:19, 53:02).
- https://youtu.be/erdFRplgF24?t=1618
- Wolfram Language's computational model, emphasizing its basis in pattern matching and term rewriting systems (26:59).
- This is contrasted with other programming language models, e.g. c, cpp, golang, python, lisp.
- Wolfram Language in Depth (tutorial)
- Wolfram: Download Wolfram Engine
- Emacs: Xah Wolfram Mode 📦
- Emacs: Xah Fly Keys 📦
- Jargon REPL and Hackers (2013)
- Structure and Interpretation of Computer Programs (SICP), Scheme LISP, JavaScript
- Command Line Interface (REPL) vs Notebook Interface
- Emacs: Evaluate Elisp Code
Graphics[Circle[{0, 0}, 1]]

Graphics[Circle[{0, 0}, 1], Axes -> True]

Graphics[
{
Circle[{0, 0}, 1],
Line[{{0,0},{2,1}}]
} ,
 Axes -> True]
StringJoin["some" , "thing"]
(* something *)

"some" <> "thing"
(* something *)
(*
2 days ago, we wrote this function that convert circle to svg.
today, we gonna modify the function, so it does lines too.
and, we gonna make it actually export to a file.
 *)

Clear[xGraphicsToSVGString]

xGraphicsToSVGString::usage = "
xGraphicsToSVGString[xGraphics]
return a string that is svg representation of xGraphics.
xGraphics is any expression with head Graphics.
";

xGraphicsToSVGString[ Graphics[gra_] ] :=
"<svg width=\"100\" height=\"100\">" <>
(StringJoin @
ReplaceAll[
gra,
{
Circle[ {x_, y_}, r_] :>
StringJoin["<circle cx=\"",
ToString[x],
"\" cy=\"",
ToString[y],
"\" r=\"",
ToString[r],
"\" style=\"fill:none; stroke:blue; stroke-width:5\" />"
],
(* <line x1="0" y1="0" x2="50" y2="10" style="stroke:black" /> *)
Line[ {{a_, b_}, {c_, d_}}] :>
StringJoin["<line x1=\"",
ToString[a],
"\" y1=\"",
ToString[b],
"\" x2=\"",
ToString[c],
"\" y2=\"",
ToString[d],
"\" style=\"stroke:black; stroke-width:5\" />"
]
}

]) <>
"</svg>"

Clear[xGraphicsToSVGFile]

xGraphicsToSVGFile::usage = "
xGraphicsToSVGFile[xGraphics, xFilepath]
Export xGraphics to SVG string and save it at xFilepath.
xGraphics is any expression with head Graphics.
";

xGraphicsToSVGFile[ xexpr_, xfilepath_ ] :=
(
WriteString[ xfilepath, xGraphicsToSVGString[xexpr]];
Close[ xfilepath ]
)

(* xGraphicsToSVGFile[ xexpr_, xfilepath_ ] := *)
(* CompoundExpression[WriteString[ xfilepath, xGraphicsToSVGString[xexpr]] *)
(* , *)
(* Close[ xfilepath ] *)
(* ] *)

(* s------------------------------ *)

xGraphicsToSVGFile[
Graphics[
{
Circle[{0, 0}, 1] , Circle[{0, 2}, 1],
Line[{{0, 0}, {2, 1}}]
}
],
"my-fantastic-function.svg"
 ]

(* success.
next to do.
need to center the origin.
need to reverse the y axes.
need to rescale the coordinate, i.e. svg viewBox.
 *)