Xah Talk Show 2026-02-20 Ep764. Wolfram language. Graphics programing. Draw tangent lines
draw tangent of a parametric curve.
(*
explain parametric equation.

this curve
y = x^2
can be written in parametric equation, as

x = fx(t)
y = fy(t)

this is called parametric equation.
 *)
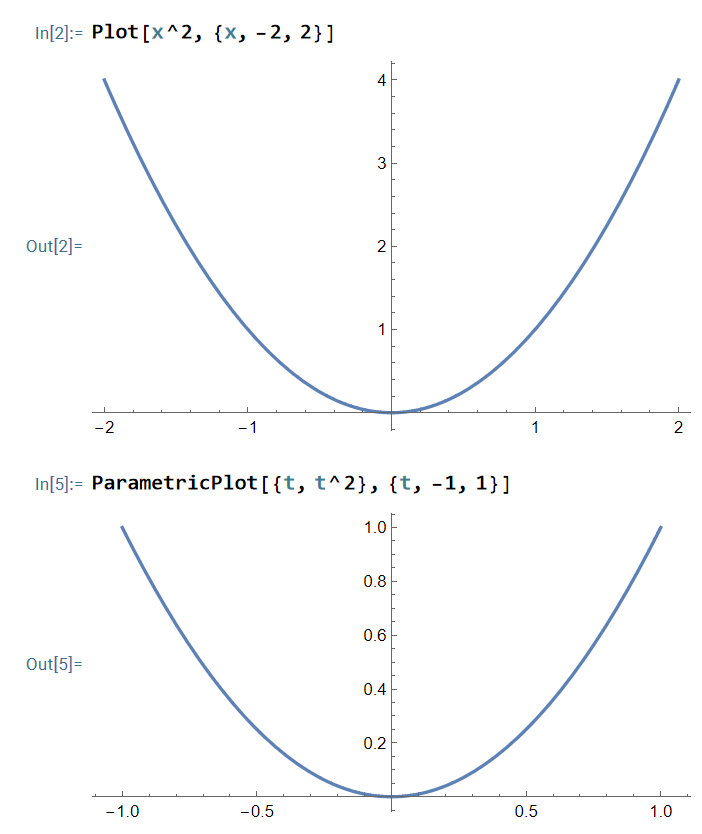
(* plot of a function *)
Plot[ x^2, {x, -2,  2}]

(* plot of the same function but in parametric equation *)
ParametricPlot[ {t , t^2}, {t,-2,2} ]
(* about the difference of Wolfram language functions Derivative vs D.

basically, the main difference is:

“Derivative” takes its arg expressed in the form of pure function Function[...], known as lambda in other languages.

while the function D takes arg in the form of an expression, and second arg to specify which is the variable with respect to.

plus, Derivative is a meta function.
It takes an arg of integer n , and return a new function that takes the nth derivative.

 *)

Derivative[1]

 [ Function[{x},x^2] ]
(* Function[{x}, 2*x] *)

Function[{x}, 2*x][3]
(* 6 *)

D[ {t , t^2} , t , 2]
(* graphics programing.
draw the tangents of y = x^2
*)

(* first, you want the parametric form.
{t , t^2}

then, you want to find the
derivative of the function for the x coordinate,
and
derivative of the function for the y coordinate.

which is
{1, 2*t}

*)

D[ {t , t^2} , t]
(* {1, 2*t} *)
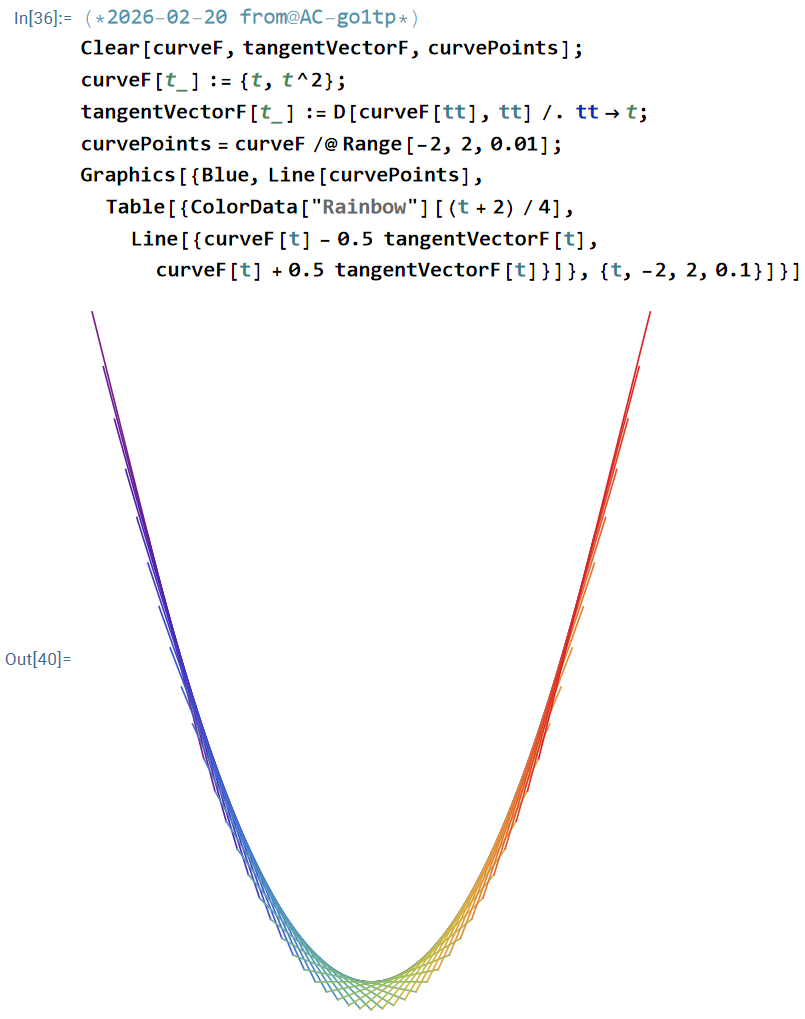
(* 2026-02-20 from @AC-go1tp *)

Clear[curveF, tangentVectorF, curvePoints];
curveF[t_] := {t, t^2};
tangentVectorF[t_] := D[curveF[tt], tt] /. tt -> t ;
curvePoints = curveF /@ Range[-2, 2, 0.01];
Graphics[ { Blue, Line[curvePoints], Table[ { ColorData["Rainbow"][(t + 2)/4], Line[{curveF[t] - 0.5 tangentVectorF[t], curveF[t] + 0.5 tangentVectorF[t]}] }, {t, -2, 2, 0.1} ] } ]
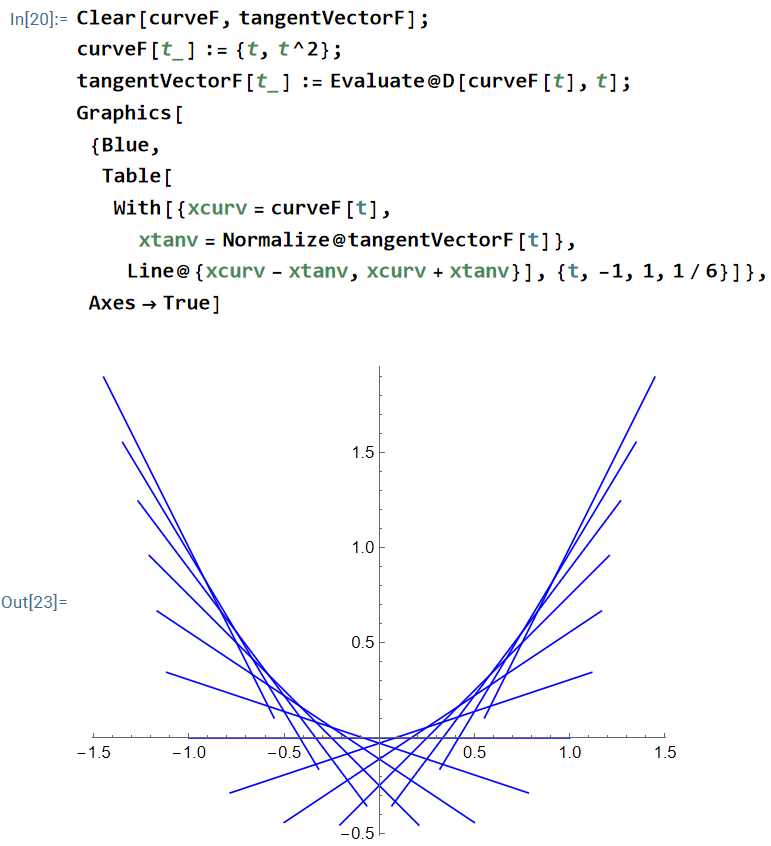
Clear[curveF, tangentVectorF];
curveF[t_] := {t, t^2};
tangentVectorF[t_] := Evaluate @ D[curveF[t], t] ;
Graphics[
{Blue,
Table[
With[{xcurv = curveF[t] , xtanv=Normalize@tangentVectorF[t]},
Line @ {xcurv -xtanv, xcurv + xtanv}
],
{t, -1, 1, 1/6}]
}
,
 Axes -> True]
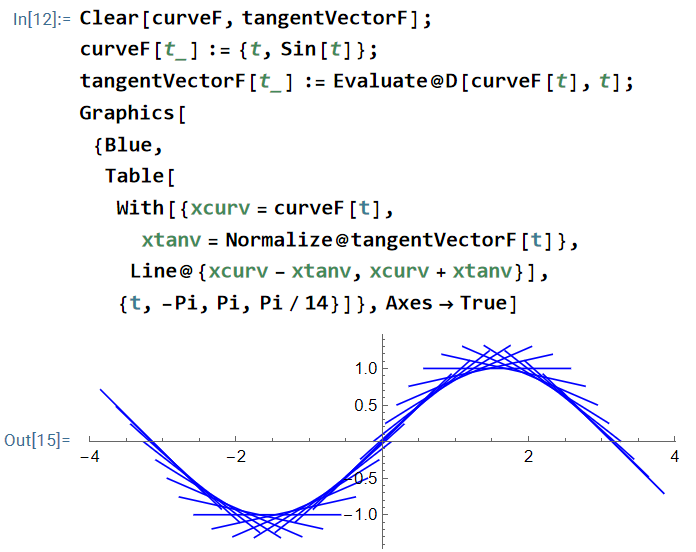
Clear[curveF, tangentVectorF];
curveF[t_] := {t, Sin[t]};
tangentVectorF[t_] := Evaluate @ D[curveF[t], t] ;
Graphics[
{Blue,
Table[
With[{xcurv = curveF[t] , xtanv=Normalize@tangentVectorF[t]},
Line @ {xcurv -xtanv, xcurv + xtanv}
],
{t, -Pi, Pi, Pi/14}]
}
,
 Axes -> True]