Requirements for a Visualization System (2010)
In this essay, i give a list of requirements that i think is necessary for a software system for creating scientific visualization for the next decade.
For the past 10 years, i have been strongly interested in mathematical visualization. I'm not a professor, and am not doing it for the educational purposes per se. Geometry has just been beautiful for me, and i'm also a professional programer. Programing computers to visualize geometric theorems or geometric objects, has been a immense personal pleasure. A particular aspect of visualization, is to design it so that when viewed, it forces a immediate and clear understanding of the object or theorem.
I have for the past couple years sought for a software platform/system where i can build 3D objects, with abilities to do interactive manipulation (such as moving a slider to change a parametric surface's parameter), dynamic rotation (viewing from different angles instantaneously), animations (such as morphing that shows geometric processes), and most of all, walk-thru in it as if it is a building (For example, the perception of actually walking on a moebius strip or Klein bottle is vastly different than just viewing it from a distance.).
In the following, i give itemized descriptions on features necessary in a visualization system, based on my experiences.
Requirement: Real-Time 3D Rotation
For math visualization, it is absolutely necessary to be able to rotate the object in real-time. For example, when viewing a complex surface, a molecule structure, or the design of a mechanical device. This requirement is so basic it warrants no further explanation.
Requirement: Real-time Interactivity
The programer should be able to build buttons and sliders that change parameters and have the object reflect these changes visually in real time.
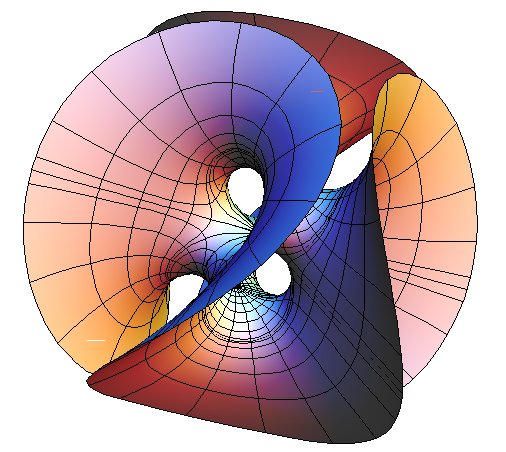
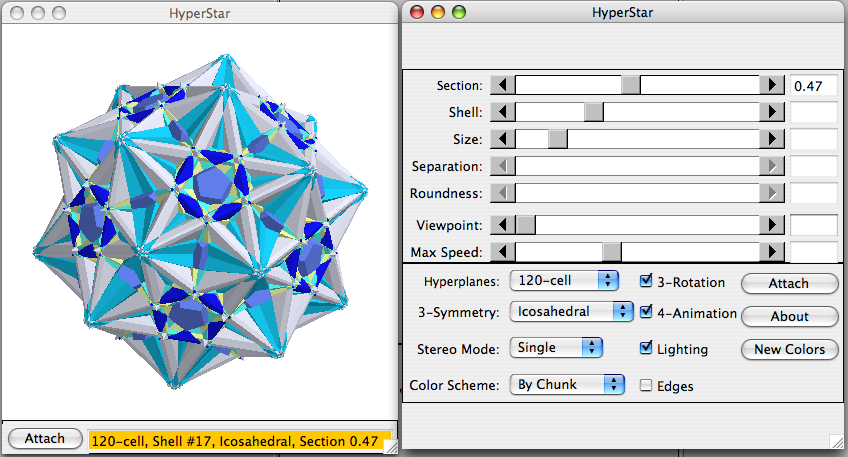
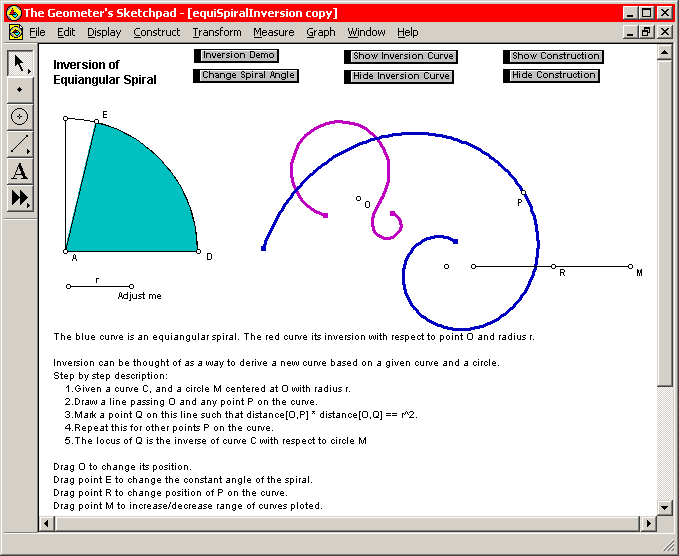
This real-time interactivity is frequently needed. For example, most math visualizations involve a function, a process, or a geometric object, that varies by parameters, and the key to the visualization is showing how the parameter changes the object or its graph. Some Examples follows.
Example: Moebius Transformation
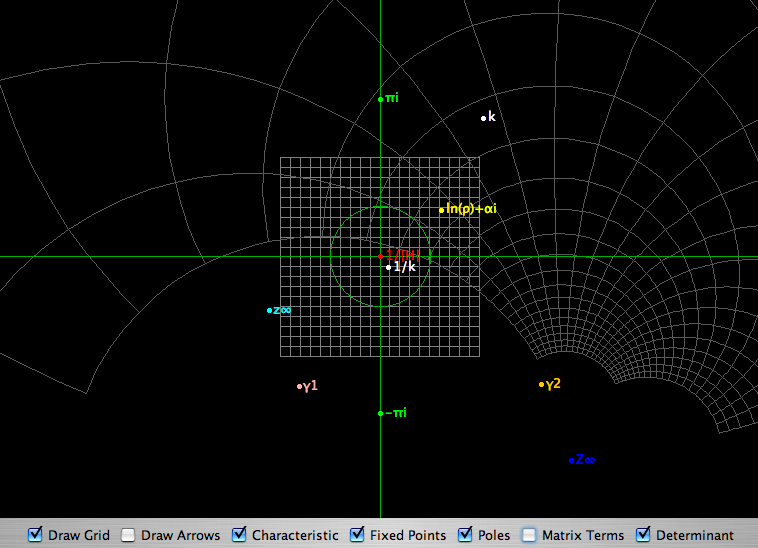
Example: Regular Polytopes
Example: Plane Geometry
Example: Conic Sections
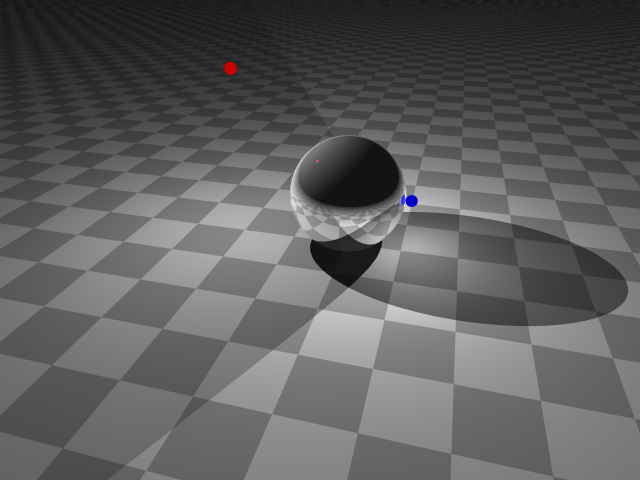
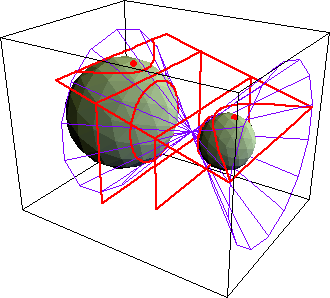

Computing power today are some 50 times faster than a decade ago.
However, math visualizations, have not advanced in any qualitative way.
For example, let's consider the simple task of plotting of polynomial equations.
As we know, 2nd degree polynomials of 2 variables are
conic sections.
It would nice, that the program can show the general form
A x^2 + B x y + C y^2 + D x + E y + F == 0
and let users change the constants by sliders, and have the graph change on the fly.
Ideally, the application would show 2 images side by side.
One image shows the planar curve, while another images shows a 3D object of a cut cone.
The user should be able to rotate the 3D cone in real time.
Moreover, there can be sliders to allow users to change the angle of the cutting plane, or the angle of the cone, and have the plane curve in the other window change in real time, as well as the corresponding equation.
Such a application would give immense feedback that reinforces learning, which is what visualization is about. Similiarly, this can be done for 3rd degree polynomials, and the visualization of polynomials of 3 variables.
There are tens, if not hundreds, elementary equation and function graphing software. However, it is almost impossible to find one that shows the power of interactivity described above. Apple Computer Inc, bundled with OS X as current as of March 2007, a plotting software (called Grapher) that has no interactivity features (except dynamic rotation). And Mathematica's abilities for plotting polynomial equations in as late as 2005, is basically the same as in 1995. Its ability for visual experiment and study of polynomials of 3 variables is practically zero. (postscript: Mathematica version 6, released in 2007 after this essay, has interactive graphics features.)
I have personally played with perhaps over 20 major plotting software over the past 15 years, and i only know one that has interactive graphing feature. (Nucalc)
Requirement: Easy-to-create, Real-Time Animation
The software system must have the capabilities for programers to build animation, and view the animation interactively in real-time (as opposed to generating the animation once and save it as a movie file).
For example, once a programer has coded the animation, she should easily play it forward and backward in the program, as well as changing parameters and re-run the new animation without going thru some compilation or export process. For example, if the animation involves a morphing 3D object, the system should also allow the user to rotate it while the morphing is on-going, all in real-time.
For example, this system should allow programer to easily create a animation that morphs a sphere into a cube, or a bunch of spheres flying in space as a swarm of flies or in some controlled artificial formation like airplanes air show.
Example: Cycloidal Curves

In this example, you can see the trace by a point on the boundary of the circle. What happens if the tracing point is nearer to the center of the circle? This is a example where a interactive slider will help. As a user adjust the slider, the animation should show its effects in real-time.
Example: Cellular Automaton
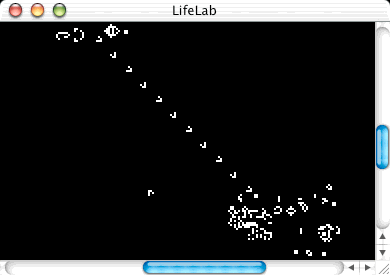
Example: Helicoid-catenoid Surface Family
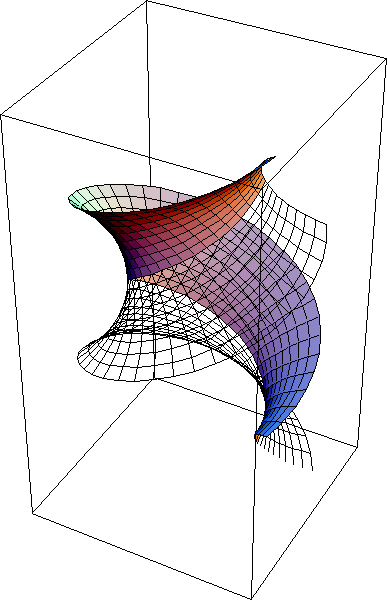
This is a example where it shows the importance of being able to rotate the object in real-time in a on-going morph.
Example: Sphere-eversion
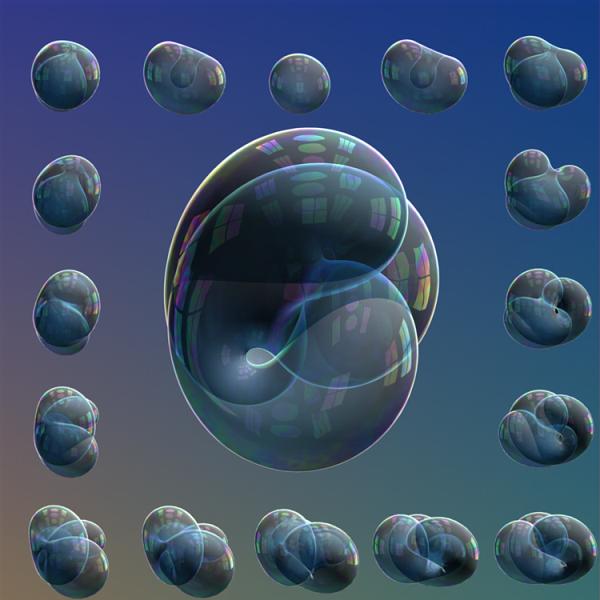
Example: Stereographic Projection
To create a visualization for the stereographic projection, ideally, the user should be able to drag and rotate or move the whole plane with respect to the sphere, as to see the effect on the mapping. Also, the user should be able to rotate the sphere and see the mapping change on the plane. The user should also be able to drag a point constrained on the sphere's surface or on the plane's surface, to see its corresponding point. Lastly, it is ideal in this visualization to let users change the pattern on plane or on the sphere to arbitrary images. For example, the plane should have a default set of images, one of a rectangular grid, and also a polar grid. (These grids would visually demonstrate the important property of circles mapping to circles) The sphere should have a set of images of projected platonic solids. (These would demonstrate the important concept of platonic solids as nets) And, the user should be able to plot the graph of arbitrary complex function on the plane to see its projected image on the sphere. (i.e. The Riemann sphere)
Today, it is non-trivial to create a visualization such as this. For example, the above image is created in Mathematica. (then the graphical data is exported into JavaView for viewing real-time rotation) To generate this static image in Mathematica, the programer needs to write a projection function that maps graphics primitives on a plane onto the sphere. Even though Mathematica is a powerful system with literally hundreds of advanced math functions and high-level graphics system, to simply create this static image, in general requires a scientist to have a couple years of Mathematica programing experience. Further, as of early 2007, Mathematica (version 5) does not support sliders or any graphical interactivity. (Note: Mathematica version 6 provides interactive features but was published after this essay was written.)
(For a Java Applet that does a small part of visualization discussed above, see stereop by John M Sullivan.)
Examples of system that do NOT satisfy the real-time animation requirement discussed in this section includes: Mathematica (up to version 5), 3D-XplorMath, most CAD systems. Most of these systems allow animations, but usually for a generate-once and save-as-static-movie-file, not designed for interactive view.
Examples of visualization systems that do satisfy the animation requirement to some degree includes: Interactive plane geometry software (2D only), Macromedia Flash (2D only), 3D Game Engines.
Requirement: 3D Walk-thru
The software system should have the capability of walk-thru or fly-thru. That is, effectively letting user to fly a camera in real-time, and view things from this camera's position and orientation.
The most obvious application of this requirement is in CAD systems that are specialized for architecture. This feature is built-in in today's 3D games, where the player can walk inside structures and look about, viewing the environment either from a so-called first-person view or 3rd-person view.
For example, if i build a fancy 3D-maze or elaborate cathedral, i should be able to say, walk inside it, so as to view the object from inside and as well as getting the experience of perceiving such a structure.
The ability to do walk-thru has significant applications in math visualization too, however, it is seldom realized. Here are some examples of its application.
Example: Walking on Surfaces
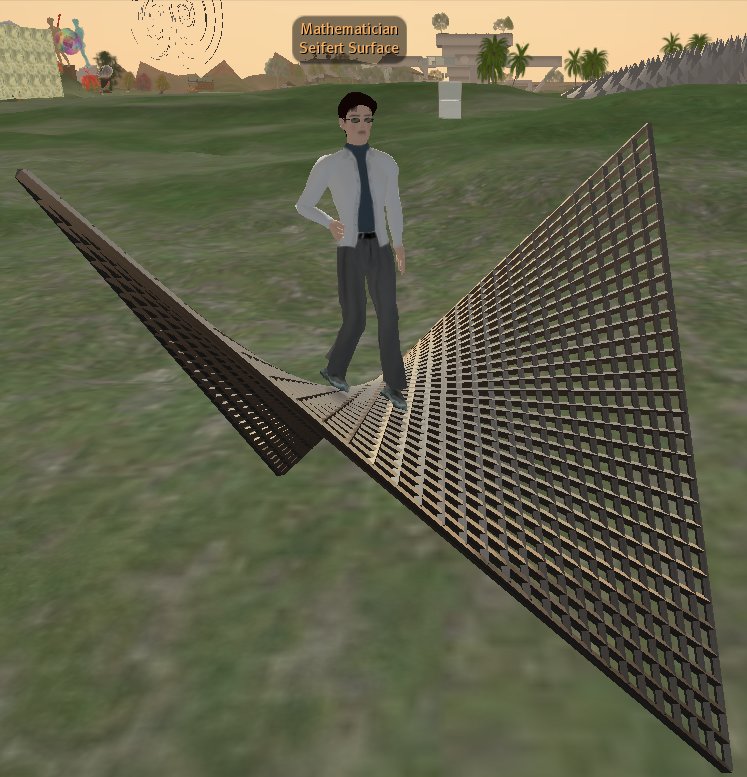
Compare the above image with the following abstract rendering that is commonly found in math visualization software.
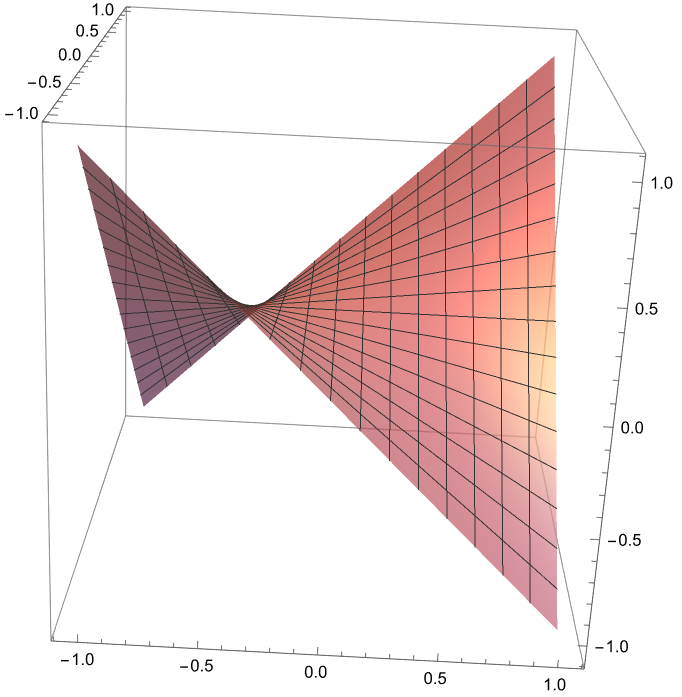
Perhaps due to the evolution of our perception system, the experience of actually walking on or inside a math object, is vastly different than just seeing it as zero-thickness abstract lines and sheets rotating around its center.
Although, the virtual world created by computer graphics only fake the experience of actually being there, still, such a virtual world experience throws a impact on understanding. Imagine, demonstrating the one-sidedness property of surfaces such as the Moebius strip or Klein bottle thru a live rotation and explanation, compared to having the student taking a walk INSIDE such a house, and suddenly felt the single-sided oddity. A person experiencing such a situation will probably remember it for life.
Example: 3D-Lattices
The ability to do walk-thrus also fits well in visualizations involving 3-dimensional lattices, such as Crystallographic group, 3D-tilings (sphere packing), or visualizing periodic minimal surfaces.
For example, the following images of periodic minimal surfaces are shown in the way they are traditionally presented, as a few representative patchs of the periodic surface, and users can rotate them in real-time.
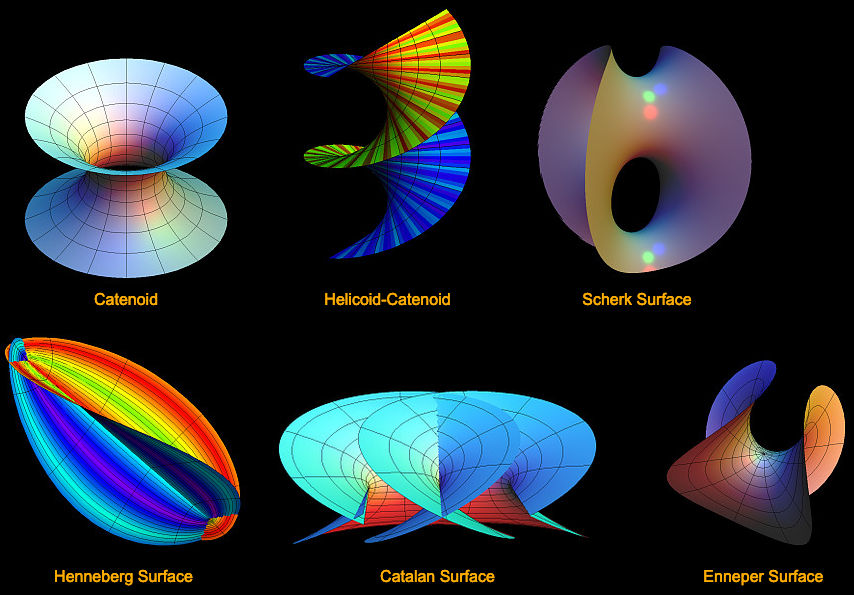
As the way they are shown, their periodic structure is not visually clear, especially those non-rectangular ones. (For example, the last 3) It takes some effort to imagine how space is partitioned by them.
Now, imagine these shown in a walk-thru system, where the space is filled with its repetitions, and the user effectively becomes a bee, flying or walking about in it, able to observe details in a close-up on any point of the surface from any angle, or getting a bird's eye's overview of the surface's lattice symmetry from a distance. More importantly, as a walk-thru model, the structure essentially becomes systematic tunnels and walls. Going thru these tunnels gives the user a maze-exploration experience, on how the space is partitioned. Our brain's construction and understanding of spacial structures by walking around it, is built into our genes (aka Path integration aka Dead reckoning.). Only with walk-thru models can we exploit this important sensory ability.
Example: 3-Manifolds
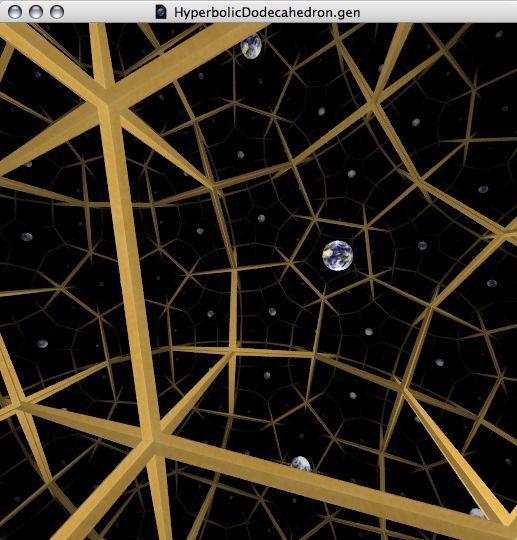
There is effectively no visualization system that lets programers easily code interactive walk-thrus. The possible exception is 3D Game Engines, however, it requires a advanced game programer with years of dedicated experience to create any thing in it, and the work is rather tedious. (typically with C++, with huge amount of understanding of operating systems, graphics hardware, lots of specialized libraries.)
(Some game engines have higher level (scripting) languages that let users (players) create objects or scenes in-world. We will discuss this in the later section of this article)
Requirement: Easy to Use for Average Programers
The system must be easy to use for average programers or scientists. For example, a person who had just a year of programing experience, should be able to code a variety of visualization projects with the system.
Often, these high-level languages are called scripting languages. Mathematica, Python, Processing Macromedia Flash, Unity (game engine), CAD systems (AutoLISP), are examples of high-level systems.
In contrast, low-level language such as Java, C, C++, C# , or, systems such as OpenGL and Game Engines, or application programing systems such as Cocoa (API) and X Window System, all require professional programers with years of experience to create even the most simple visualization. These are not useful to most scientists or engineers.
Requirement: Rich Builtin Set of Primitives
The system must have a set of basic primitives or shapes that serve as building blocks. For example, spheres, torus, cubes, as well as meshes of triangles. Also, more complicated surface such as parametric surfaces and algebraic surfaces. (For example, all these primitives are supported by the 3D-modeler and rendering engine POV-Ray.)
The system should support various standard coordinates systems (cartesian, polar, spherical, cylindrical), projection systems (central, parallel, panaramic for global, and stereographic, cylindrical, etc for local or per object dimensional change), lighting system (multiple light sources, full color control, shadowing) and camera control system. (Most items here are supported by POV-Ray.)
The system should have built-in support for dimensions higher than 3. It should have buildin facilities to easily project or slice a higher-dimensional object into 3D object. (e.g. as demonstrated by Mark Newbold's Hyperstar Java Applet for visualizing higher dimensional Regular polytope.)
The system should also support non-euclidean models. (e.g. Supported by the visualization system JReality, and demonstrated by Jeff Week's 3-manifold fly-thru software CurvedSpaces)
A whole set of buildin 2D, 3D geometric transformation functions. (these should be general to work on n-dimensional coordinates)
For a system aimed for math visualization, it would also be necessary to have access to a full range of math functions, such as integration, derivative, so called elliptic functions and other special functions. (For example, Mathematica)
Existing Systems
I have been a professional programer since 1995. In my career, i have written a good number of math visualization programs, mostly in Mathematica. I have also played with perhaps hundreds of programs, tools, 3D-formats, and animations of 3D visualizations. Though, i have not worked in a industry that specializes in 3D-visualization or creation (such as working on a 3D game engine, research in computational geometry, research in computer graphics software technologies, nor as artist for 3D-model creation or animator for movie/gaming studios.).
In my limited experience, i find no software platform for visualization close to the ideal of what i need to do. They lack one feature or the other, or otherwise requires the programer to be a specialist with years of dedication in learning the tool. Here i list some systems i know and their shortcomings.
Mathematica
Mathematica is a general technical computing system that is a pioneer through-out the 1990s as not only a computer algebra system, but as well as a math-knowledge representation system (compare: LaTeX) and a math visualization system. As a system of these combined qualities, it has made major impact in math visualizations among mathematicians, scientists, and engineers. (Early science fiction movies from Hollywood's big movie studios, have used animations produced by Mathematica before dedicated 3D Modeling/Animation systems were popular. (For example, The Lawnmower Man (1992 film)) ) Mathematica can solve complicated equations or compute advanced functions in a few characters of code, that often requires ten times or hundred times of bulk in common languages such as Java or even LISP. Similarly, the visualization system build into the language and application, easily allows a programer to create and display fairly complex math objects that requires tens or hundreds of lines in other systems.
As great as Mathematica is, as of early 2007 it still lacked several major features for visualization that appeared in other systems for quite a number of years. One of the feature Mathematica lacks is the ability to rotate a 3D-object in real-time. This is easily mended since there are Mathematica plug-ins that does this in as early as 1995. However, Mathematica still does not have the ability to create interactive graphics, such as sliders. The upcoming Mathematica version 6, is reputed to have this feature. With that in mind, one final feature Mathematica lacks may be the ability to do walk-thrus.
(Note: Mathematica version 6 is released in 2007-05, 2 months after this article. It is a major release, containing many break-thru technologies, including interactive graphics. It is the best general visualization system by far. As of 2007-08, I have not yet been familiar with Mathematica 6 to give a detailed account in the context of this article. See: http://demonstrations.wolfram.com/ for the company's demonstration. )
3D-Modeling Systems
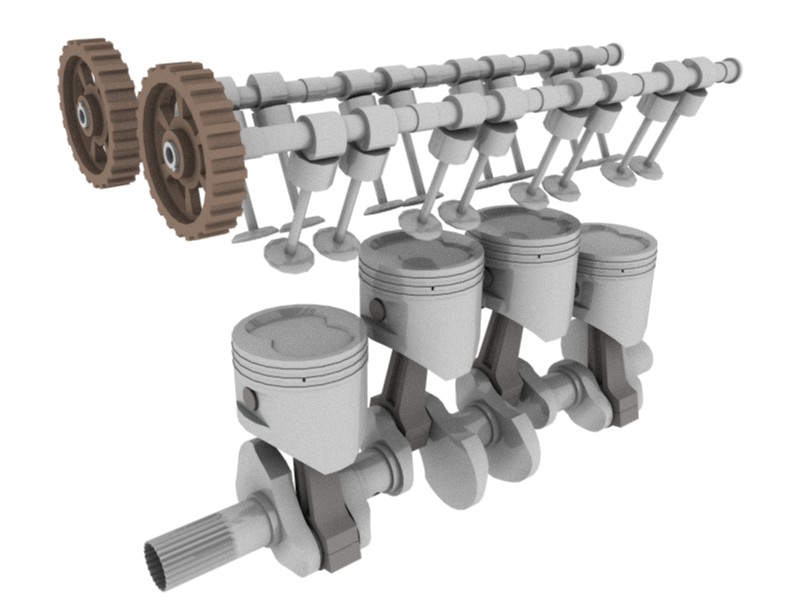
POV-Ray is a generic 3D-modeling software. Like other 3D-modelers such as AutoCAD, 3DS Max, etc. They are great in building 3D objects such as car engines, houses, circuit board designs, or Hollywood animations, but they are not designed for real-time interactivity, animation, or walk-thru. Most of these systems can create animation in a run-once movie format.
Java Applets
Java the programming language is a general system that allows programers to write applets, which allows programer to create 3D objects with rotation in real-time, and or have sliders or active areas for interactive manipulation. Due to the self-contained, run-in-browser nature of applets, it ushered a vast number of small visualizations applets especially from 1997 to early 2000s. (many examples in this article are Java applets)
However, Java is a low-level language. Programing in Java is extremely unnecessarily complex. In general it takes a professional Java programer with 1 or more years of experience to be able to create visualization applications. Java does not support complex numbers, nor natively provide a 3D object display system, nor provide any geometric building blocks such as meshes, spheres and toruses. (Java has a Java3D library that went on and off over the years) And, for each single instance of visualization project, it often takes months to create. (as opposed to few hours in high-level systems, such as Mathematica.)
2D Interactive Plane Geometry Software
There is a class of interactive geometry software, pioneered by Geometer's Sketchpad in the early 1990s. For many years starting around ~2001, a dozen such software have sprang up, perhaps due to the availability of Java Applets programing environment, as well as the relative ease of creating software that focus on only 2-dimensional geometry. (For screenshots, see: Great Software for Plane-Geometry)
Interactive plane geometry software are wonderful tools made possible by technology. Such program allows one to construct plane geometry drawings dynamically, much in the way of Greek's “Ruler and Compass”. For example, draw a triangle with lines bisecting the 3 angles. They intersect in a point called the incenter of the triangle. (which is also the center of the largest possible circle inside.) Now, you can drag the corners of your triangle to change its shape, and all your drawings change accordingly. Because of such dynamic power, a few theories on plane geometry have been found because of such software.
As a visualization system, Geometer's Sketchpad (et al) is a excellent example that has made a major impact to (plane geometry) mathematics by its sheer visualization power. It is extremely ease to use, essentially unlimited in constructing 2D figures, versatile interactive features as sliders or dragging points, real-time interactive animation (such as curve family, tracing points, tracing envelopes or rays for optics study), and macro abilities (constructing figures by a scripting language)
With respect to this article, the only problem it has is lack of 3D support. As of 2005, a 3D version of interactive geometry software appeared on the scene. One such example is http://www.cabri.com/v2/pages/en/products_cabri3d.php
Macromedia Flash
Macromedia Flash application seems to have become the standard vector-graphics animation system in web browsing since about 2005. A huge number of 2D games have been written in it. I think it is a very elegant system, however, the flaw may be that it is mostly only a 2D system. 2D systems, have always been relatively easy to create. Flash is perhaps the pinnacle of such a system.
Game Engines
The one class of system that satisfies all the major requirements in this article is 3D Game Engines. But alas, they take a dedicated game programing specialist to be able to use it.
3D Game Engines are the hearts of 3D video games, with billions of dollars poured into the industry. It is a very complicated piece of software, which also contains or is part of a physics emulation engine. In terms of complexity with respect to technology, 3D Game Engines are often few magnitude more complex than most visualization applications. 3D Game Engines is in essence the ultimate visualization system, in that it is aimed to visually render real life scenes, including animals, clothing, cars, fire, running water, lights, shadows, clouds and fog, trees, mountains etc, in real-time. Some of these objects, such as skirts, clouds, animals, are constantly moving and changing forms in complex ways. And such systems also have to deal with physics, otherwise movements will not be natural or too complex to code for each moving item. 3D Game engines often are also a culmination of networking technologies, since they have to deal with thousands or tens of thousands players simultaneously as a server/client software system, including handling chatting (sometimes voice chat) among online players. It is not a wonder, such a engine often are licensed for hundred thousands of dollars.
Many 3D games have a scripting language, that let users create scenes or otherwise control elements in the game. I have come to know a virtual world called Second Life, and become familiar with its 3D-modeling and scripting system called LSL (Linden Scripting Language). In the following, i explain its advantages, and major problems, as a math visualization system.
!!!Second Life and Linden Scripting Language (Work in progress)!!!
First of all, in the context of this article, Second Life is a 3D-game, implemented using a 3D game engine. A 3D-game engine is usually more complex than average scientific visualization systems, since it needs to render human forms and facial expressions, and have to deal with animal movements and collisions, all in real-time. Rendering animal and animal movements are usually far more complex than the typical engineering needs of rendering mechanical devices or its movements. Also, since 3D-games aim to emulate real-life scenes in all its aspects, such as girl's hair, wavering flags, flowing river, lake and sea, ocean sea waves, bonfire, fog, lamps, sun light, shadows, warplanes dogfighting with explosions, sword fighting with gushing blood, flashing dance club floors, laser shows, and neon-signs etc, the requirement and burden on 3D-rendering engines for games is in general a order of magnitude more complex than typical scientific visualization systems. Consequently, when using 3D game engines as a visualization tool, it has certain advantages not possible in typical visualization systems. In a sense, 3D-rendering engines used in modern games is by definition the ultimate visualization system.
As software using 3D-game engines, it has several advantages not available in normal 3D visualization systems. Here are some examples:
Second Life: Virtual World Environment
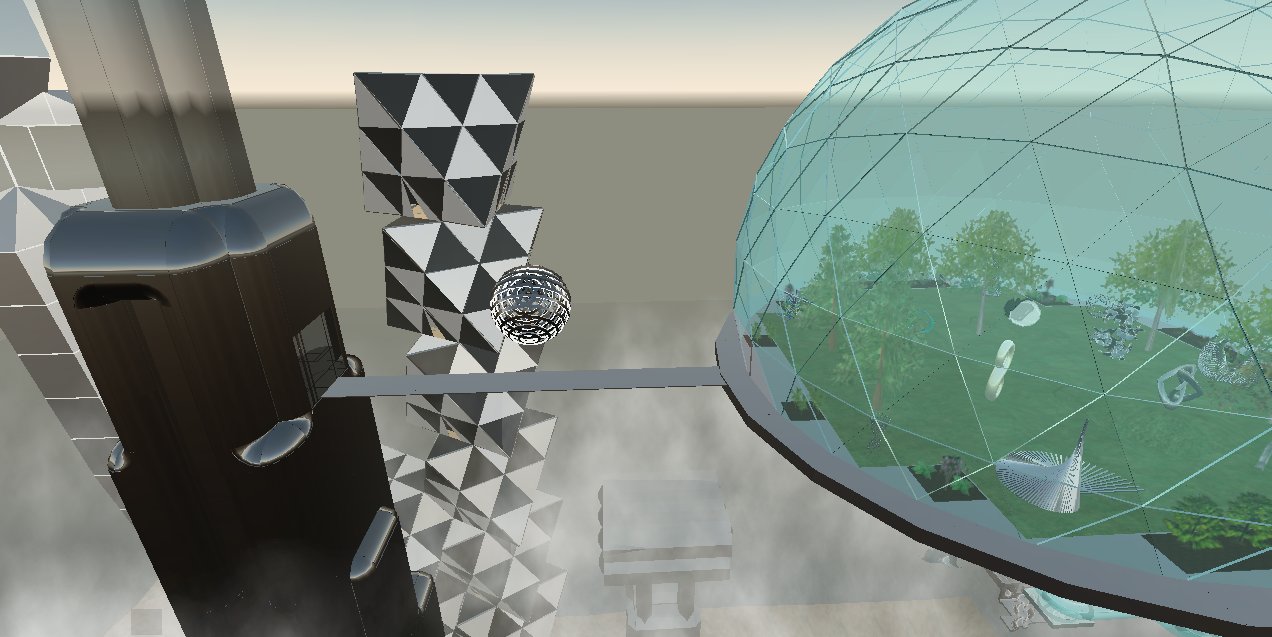
Immediately, game-engine based systems is a virtual world by default. Namely, that users see themselves as a human character moving in a virtual world (so-called third-person view). Or, as a walking camera (so-called first-person view). So, with a 3D-game, it provides the Walk thru feature by default. It is common in 3D games where the players have to go thru fantastic architectures with hidden chambers, twisted tunnels, or 3D-mazes.
As have described previously, walk-thrus is necessary in large-scale or architectural models, in visualizing 3-manifolds, 3D-lattice structures and symmetry, and, the realism and experience of perception inside a virtual world gives us a understanding that is a order more memorable and conceivable than abstract renderings of lines and triangle patches that form surfaces.
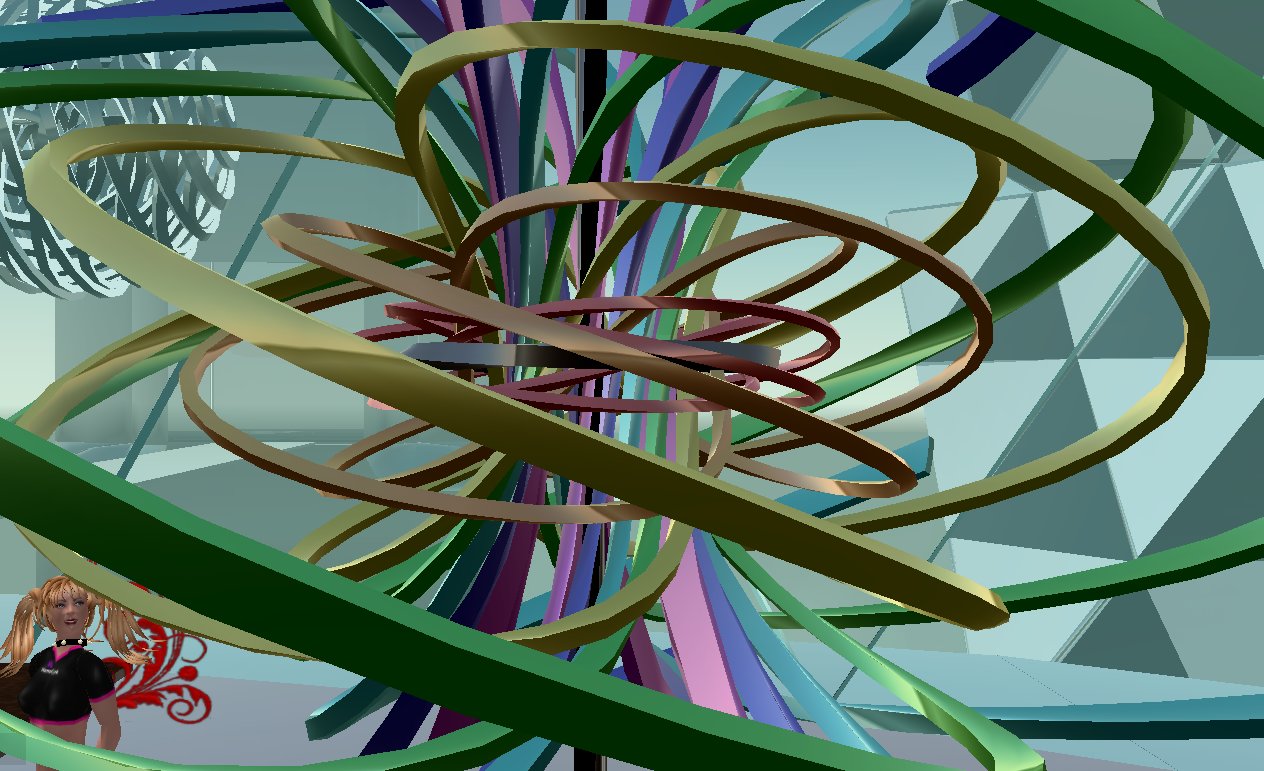
Second Life: Virtual World Interactivity
Another immediate advantage in game systems is the spontaneous interactivity. Previously, we have talked about how important is the interactivity feature in a visualization system. Namely, buttons, sliders, …, real-time manipulations.
3D-game engines by default is a spontaneous real-time system. By spontaneous, it is meant that things in it are not usually preprogramed. But rather, a system is provided (such as a physics engine), that computes on the fly what should happen as users interact inside the system.
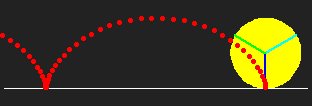

For example, previously we've shown a movie of a rolling circle that generates the cycloid curve. This animation can be programed by pre-computing each frame. For each frame, the position of the circle and the position of the traces are calculated, then drawn to generate a image, then these these images are sequenced together into a movie. This would be a pre-computed visualization.
Alternatively, the same movie can be generated using a Interactive Plane Geometry software as we have discussed previously. In such a system, the programer sets down the mathematical relation between the elements. Then, as the user moves a slider that corresponds to the changing contact point, all element's positions are computed on the fly by the system and rendered on the screen.
The above is a example of a pre-computed animation versus interactive animation. The former is hard-coded, less-flexible, and requires a lot programing time, while the later relies on scripting on top of a general system. (In this example, this “general system” is one that understands plane geometry.)
Analogously, game engine is a general system that understand 3D-geometry, and in many cases, also the physics of motion. As a 3D-rendering engine, the programer is freed from having to program the immensely complex problems of displaying 3D-objects on a 2D-screen in a fast and efficient manner. (these efforts went into the engineering of the graphics processing unit (GPU) and the 3D software layer such as OpenGL and Direct3D) As a physics engine, the programer is freed from computing the position of each moving object, but instead can simply assign a object's mass and movement characteristics, and it will move in a realistic way from real-time directional inputs by user, with collisions shown convincingly as well.
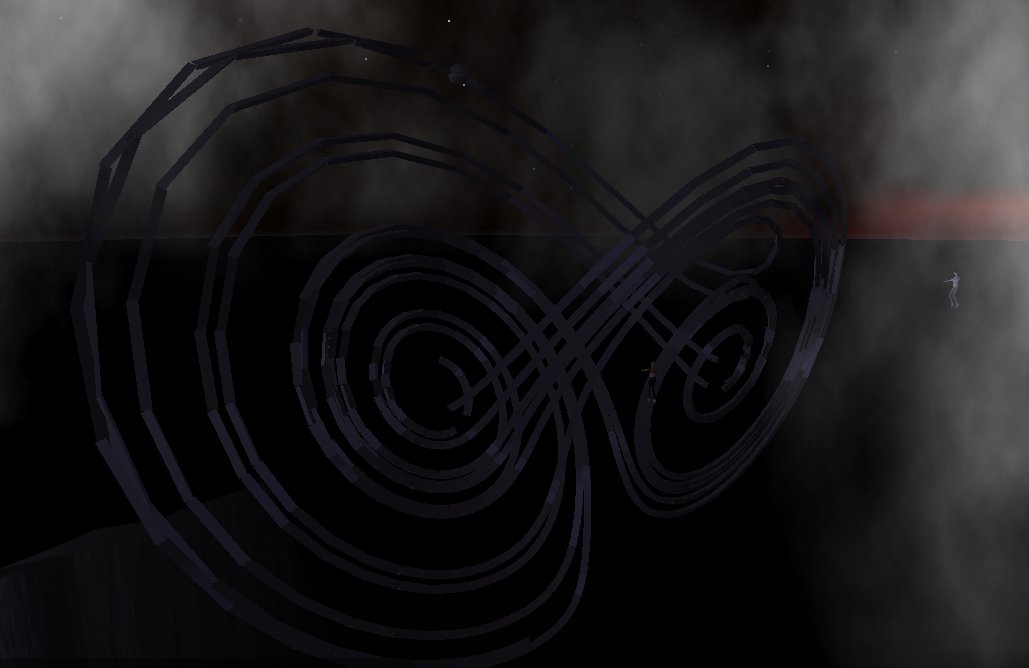
Today's Game Engine Problem: Faking to achieve realism (work in progress)
… explain limits with current computer graphics technology… many things, are faked using textures. And things like hair, cloud, moving water, fire… are also faked by various means (particle system).
Also, objects in 3D games do not have the precision necessary for 3D visualization. For example, due to the need to minimize network transmission, the 3D-modeling system in Second Life is quite bizarre. In practice, it is impossible to even render a parametric surface, or anything that requires a lot polygons.
precision mechanics is impossible…
details … Examples… screenshots…
Game Engine Advantages (work in progress)
Explain how game engines, or how systems similar to today's game engines, IS the future of visualization systems. That is, primarily it needs a 3D rendering system, and a physics system, and with a scripting language in-world. But in addition, for it to become a visualization system for the scientific visualization community, it needs to add the whole set of math functions (various projections, quaternions, complex numbers, higher-order functions, common geometric transformations.)
Ideally, as a comprehensive engine, it should also support different geometries (i.e. non-Euclidean) and other spaces of 3-manifolds, and functions to slice or project them to 2D or 3D.
Today's game systems do not support these because they are not needed in game playing. (For example, it is ok for a car engine to not be precise as long as it looks like a car engine. (as opposed to, a car engine in CAD needs to be precise down to manufacturing precision).)
details… examples… screenshots…
Some summary and outlook (work in progress)
For example: Second Life's LSL… but since it is not a system designed for visualization, but rather a scripting language for a 3D game, it has its own bag of flaws and major problems when used as a 3D-visualization system.
For example, its scripting language is based on events, since it is designed to control characters and movements the game as part of the physics emulation engine. It is not focused on object-creation. The building blocks (prims) in the system also have very odd shapes and limit in size that makes it extremely tedious to create shapes as simple as a large disk.
I think the future in visualization software, will be scripting languages on top of 3D Game Engines. More specifically, a software that is similar to today's 3D Rendering Engines, with a scripting language on top.
See also: QuickDraw 3D, OGRE 3D
Promising Solutions
Some promising solutions:
- Mathematica 6 or later. Starting with Mathematica version 6, released in 2007, it support many interactive visualization features, such as sliders for animation. The resulting interactive graphics or animation automatically uses GPU. However, the system does not support walk-thru or fly-thru, and that is not likely to be there in the near future.
- Google's O3D. http://code.google.com/apis/o3d/. O3D is pretty much bringing game engine to the web browser, and using a high-level language JavaScript for programing it. This way, scientists can use a high-level lang to focus on coding their 3d content, and don't have to worry about compilers or OpenGL or other tedious graphics programing technicalities, yet the graphics is automatically optimized and runs on GPU.
- Processing. A high-level programming language for visualization. I think it is primarily for 2D, but with some 3D support.
- Demomaker, in particular, the software “werkkzeug1” at http://www.theprodukkt.com/werkkzeug1. This is from the sub-culture of “hackers” creating eye-catching “demo” animations for games or other things with the minimal amount of code.
- Game Blender, a sub project from the 3D modeler Blender. Using Blender as platform for creating real-time interactive content.
- Mathematics in Second Life (annotated image gallery)
- Algorithmic Mathematical Art (illustrated essay)
- Mathematical Models of 3D Inputs Control
- Illustrating Geometry with POV-Ray
- Graphics Programing Pains (2007)
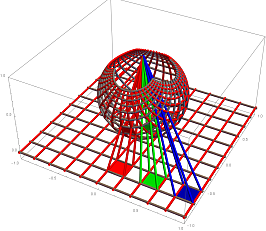 Stereographic Projection