Wolfram: Mesh Region Examples
By Xah Lee. Date: . Last updated: .
xtodo
work in progress
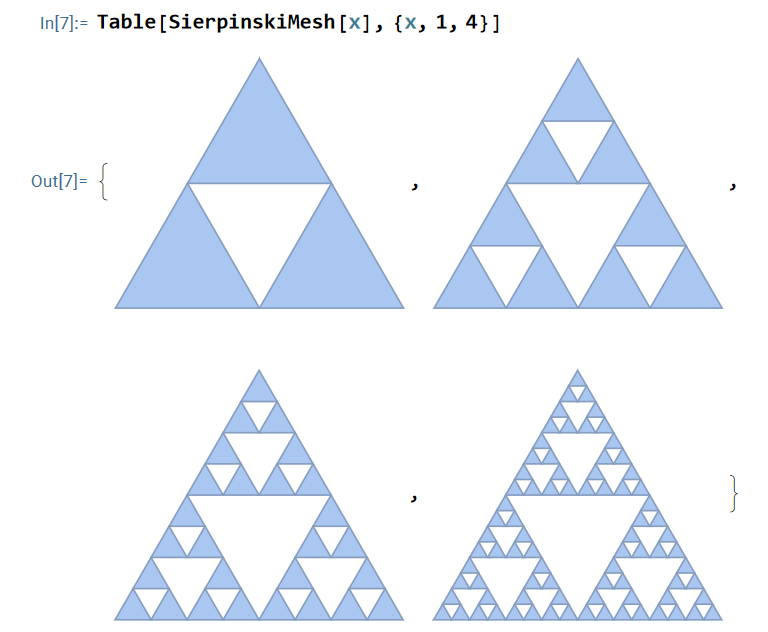
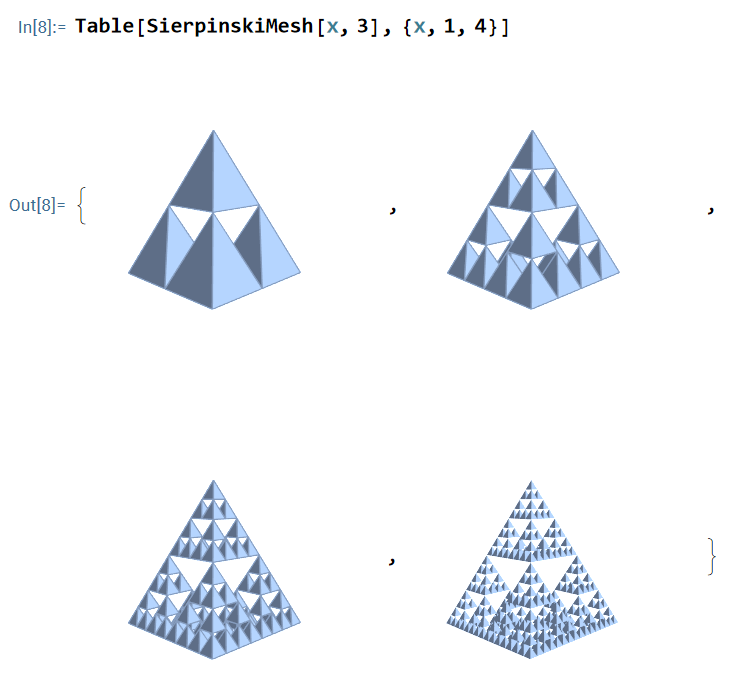
SierpinskiMesh
Table[ SierpinskiMesh[x] , {x, 1, 4}]

Table[ SierpinskiMesh[x,3] , {x, 1, 4}]
 Wolfram language SierpinskiMesh 2025-09-20 25b42
 Wolfram language SierpinskiMesh 2025-09-20 25b58
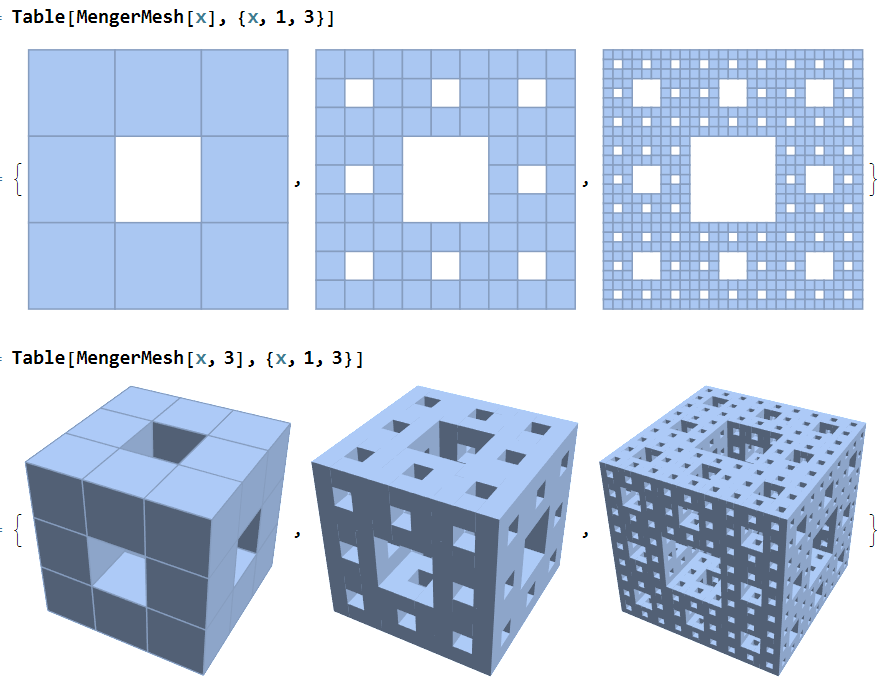
MengerMesh
Table[ MengerMesh[x] , {x, 1, 3}]

Table[ MengerMesh[x,3] , {x, 1, 3}]
 Wolfram language MengerMesh 2025-09-20 2caf4
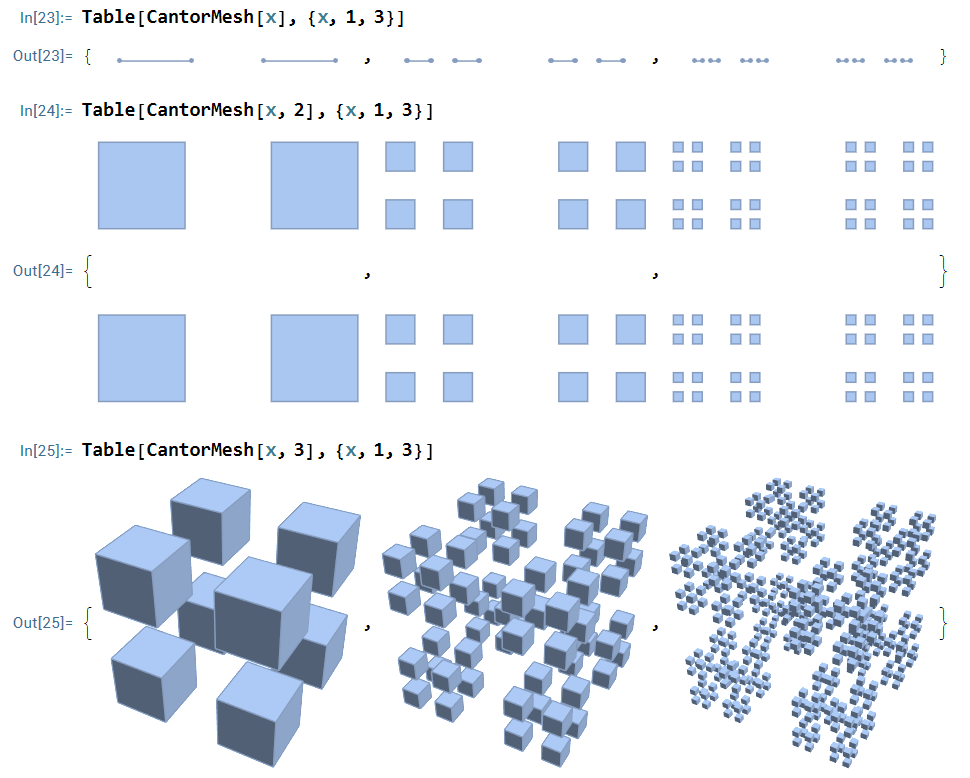
CantorMesh
Table[ CantorMesh[x,1] , {x, 1, 3}]

Table[ CantorMesh[x,2] , {x, 1, 3}]

Table[ CantorMesh[x,3] , {x, 1, 3}]
 Wolfram language CantorMesh 2025-09-20 2cce1
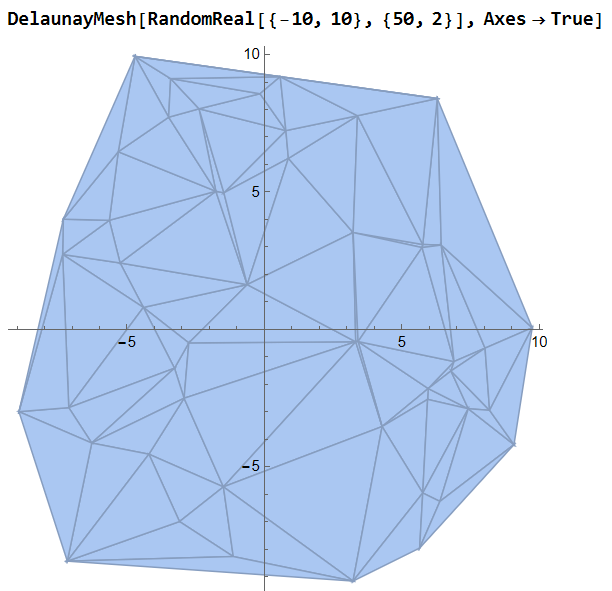
DelaunayMesh
DelaunayMesh[RandomReal[{-10, 10}, {50, 2}], Axes -> True]
 Wolfram language DelaunayMesh 2025-09-20 2cef1
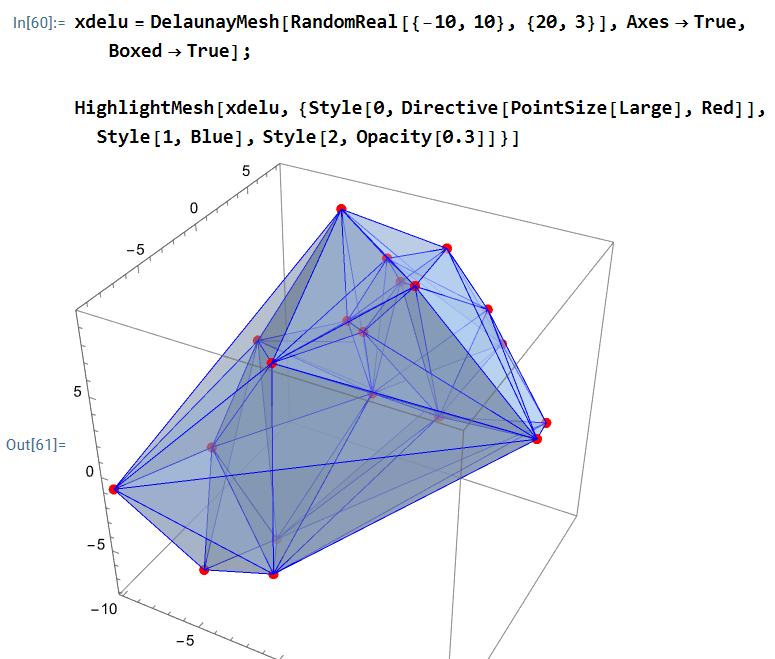
xdelu = DelaunayMesh[RandomReal[{-10, 10}, {50, 3}], Axes -> True,
   Boxed -> True];

HighlightMesh[xdelu,
{Style[0, Directive[PointSize[Large], Red]],
 Style[1, Blue],
 Style[2, Opacity[0.5]]}]
 Wolfram language DelaunayMesh 2025-09-20 2d314
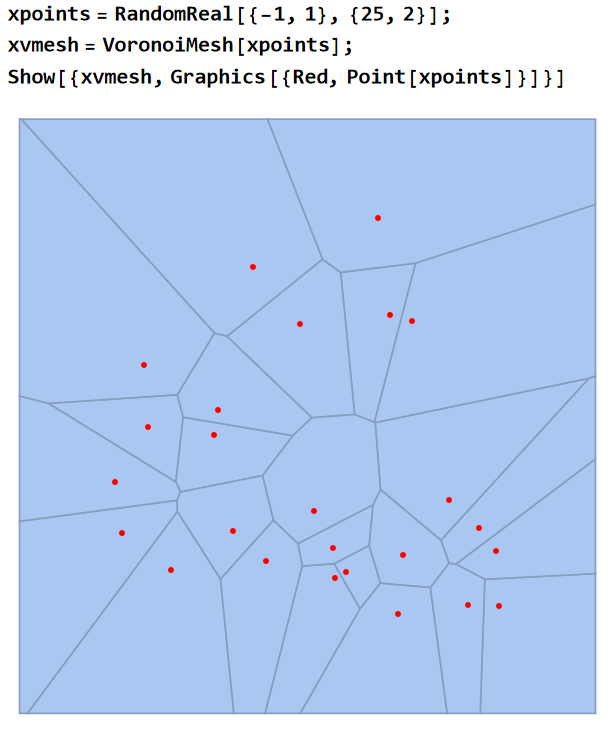
VoronoiMesh
xpoints = RandomReal[{-1, 1}, {25, 2}];
xvmesh = VoronoiMesh[ xpoints];
Show[{xvmesh, Graphics[{Red, Point[xpoints]}] }]
 Wolfram language VoronoiMesh 2025-09-21 346cc
xpoints = RandomReal[{-1, 1}, {25, 3}];
xvmesh = VoronoiMesh[ xpoints];
Show[{xvmesh, Graphics3D[{Style[Point[xpoints], Red, Opacity[0.5]]}] }]
xpoints = RandomReal[{-1, 1}, {25, 3}];
VoronoiMesh[ xpoints, MeshCellStyle -> {{0, All} -> Red, {2, All} -> Opacity[0.5]}]
Wolfram. Graphics Programing