Wolfram: Graphics Programing. Index
Wolfram. Graphics Programing
- Wolfram: Graphics Programing. Index
- Wolfram: Graphics Primitive
- Wolfram: Graphics, Graphics3D
- Wolfram: Graphics Directive
- Wolfram: Geometric Transformation Functions
- Wolfram: Apply Transform to Graphics
- Wolfram: Compose Transformations
- Wolfram: Translate Copy Graphics
- Wolfram: Transformation Matrix
- Wolfram: GraphicsComplex
- Wolfram: Mesh Region
- Wolfram: Mesh Region Examples
- Wolfram: Extract Graphics from Plot Functions
- Wolfram: Graphics Misc
- Wolfram: Animation
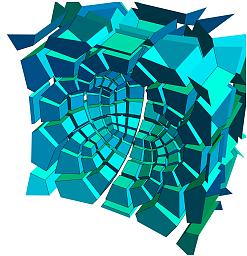 Geometric Inversion