Linux: Monitor Processes: top
Linux top is a command line program that lets you monitor CPU usage.
In terminal, type top. Then, try the following in order:
- z
- Toggle color.
- x
- Toggle coloring of sort column.
- s 9 9 Enter
- Set update frequency to every 99 seconds.
- Space
- Force a update.
- >
- Change the sort column to the right of current sort column.
- <
- Change the sort column to the left.
- R
- Toggel reverse sort order.
- O k Enter
- Order by CPU usage. (also P)
- O n Enter
- Order by memory usage. (also M)
- O a Enter
- Order by pid.
- O x Enter
- Order by process name.
- c
- Show full path of commands.
- k
- Kill a process by pid.
- u userName
- Show only processes of a user.
- h
- Help.
- q
- Quit.
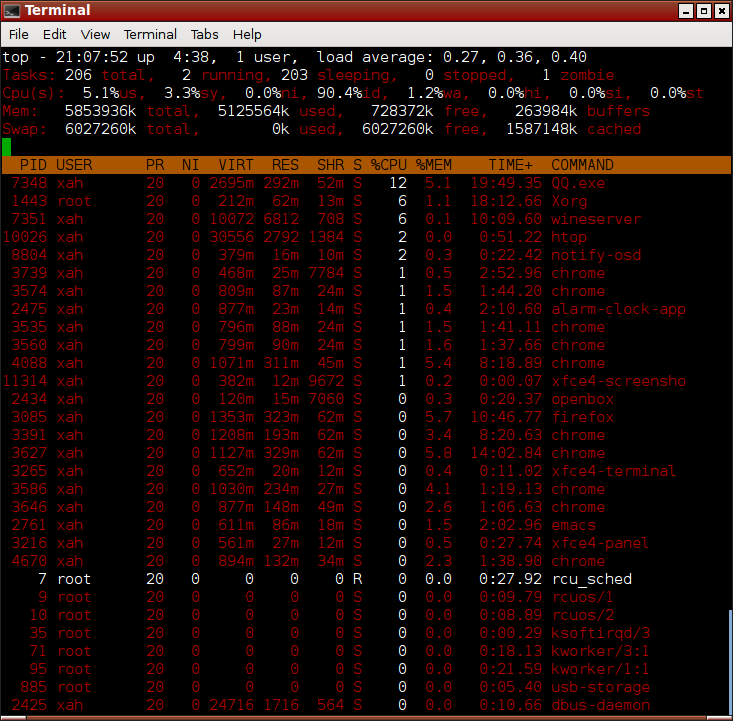
Summary Area
top - 12:59:21 up 20:59,  0 users,  load average: 1.05, 0.93, 0.90
      current     system                     past 1 min, 5 min, 15 min
      time        uptime
- If you have 1 CPU core, than load average of 1 means 100% CPU usage.
- If you have 2 CPU core, than load average of 2 means 100% CPU usage.
- If you have n CPU core, than load average of n means 100% CPU usage.
In general,
“load average”/“number of cpu core” = CPU load.
Higher than 1 means overloaded.
Tasks: 139 total, 1 running, 137 sleeping, 0 stopped, 1 zombie
Cpu(s):  5.4%us, 32.4%sy,  0.0%ni, 62.2%id,  0.0%wa,  0.0%hi,  0.0%si,  0.0%st
          user    system    niced     idle   IO wait
- us = User CPU time
- The time the CPU has spent running users' processes that are not niced.
- sy = System CPU time
- The time the CPU has spent running the kernel and its processes.
- ni = Nice CPU time
-
The time the CPU has spent running users' proccess that have been niced. (see:
man nice) - wa = iowait
- Amount of time the CPU has been waiting for I/O to complete.
- hi = Hardware IRQ
- The amount of time the CPU has been servicing hardware interrupts.
- si = Software Interrupts
- The amount of time the CPU has been servicing software interrupts.
- st = Steal Time
- The amount of CPU “stolen” from this virtual machine by the hypervisor for other tasks (such as running another virtual machine).
Mem:    800340k total,   652680k used,   147660k free,    45688k buffers
Swap:   818172k total,     8584k used,   809588k free,   315372k cached
Actual free memory (RAM) available to programs is: free + buffers + cached. For detail, see: Linux: Show Free Memory .
Better is to see memory usage visually. Use htop.
[see Linux: Monitor Processes, htop]
PID USER PR NI VIRT RES SHR S %CPU %MEM TIME+ COMMAND
- PID
- Process Id
- USER
- User Name
- PR
- Priority
- NI
- Nice value
- VIRT
- Virtual Image (kb)
- RES
- Resident size (kb)
- SHR
- Shared Mem size (kb)
- S
- Process Status
- %CPU
- CPU usage
- %MEM
- Memory usage (RES)
- COMMAND
- Command name/line
- TIME+
- CPU Time, hundredths
For some explanation of these, do man top.
Common Top Options
top -d 9- Run top with delay (update frequency) set to 9 seconds.
top -u john- Show only processes from user john.
top -n 10- Run top with 10 updates, then exit.
top -b -n 1 > top_out.txt-
Dump top output as plain text to a file. The “-b” means batch mode. Basically, in batch mode, it dosn't accept any interactive inputs. If you run
top -b, use Ctrl+c to exit.
Better top: htop
unix “top” is a very old program. It has some problems. For example, sometimes you want to view one particular process, but if you don't have a long screen, it's very diffucult or impossible, unless you find the pid first than call top -p pid.
A much better one is “htop”. See Linux: Monitor Processes, htop.