Caustics
History
From Robert Yates:
Caustics were first introduced and studied by Tschirnhausen in 1682. Other contributors were Huygens, Quetelet, Lagrange, and Cayley .
Description
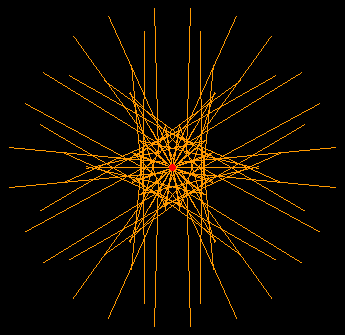
Caustic is a method of deriving a new curve based on a given curve and a point. A curve derived this way may also be called caustic. Given a curve C and a fixed point S (the light source), catacaustic is the envelope of light rays coming from S and reflected from the curve C. Diacaustic is the envelope of refracted rays. Light rays may also be parallel, as when the light source is at infinity.
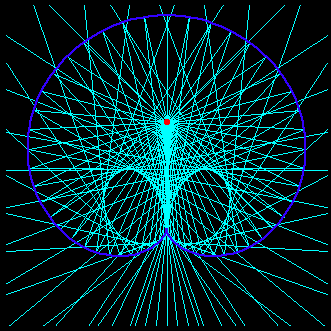
Caustic do not always generates a curve. For example, the light rays reflected from a parabola's focus do not intersect, therefore its envelope do not form any curve. Another example is illustrated by the catacaustic of a astroid .


Properties
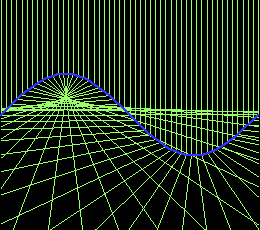
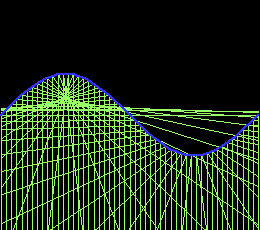
Catacaustic and Diacaustic with parallel rays
Catacaustic of a curve C with parallel rays from one direction generate a curve that is also the diacaustic of the curve C with parallel rays from the opposite direction.

Curve relations by caustics
| Base Curve | Light Source | Catacaustic |
|---|---|---|
| circle | on curve | cardioid |
| circle | not on curve | limacon of Pascal |
| circle | Infinity | nephroid |
| parabola | rays perpendicular to directrix | Tschirnhausen's cubic |
| Tschirnhausen's cubic | focus | semicubic parabola |
| cissoid of Diocles | focus | cardioid |
| cardioid | cusp | nephroid |
| quadrifolium | center | astroid |
| deltoid | Infinity | astroid |
| equiangular spiral | center | equiangular spiral |
| cycloid | rays perpendicular to line through cusps | cycloid 1/2 |
| y==E^x | rays perpendicular y-axis | catenary |
generic code
work in progress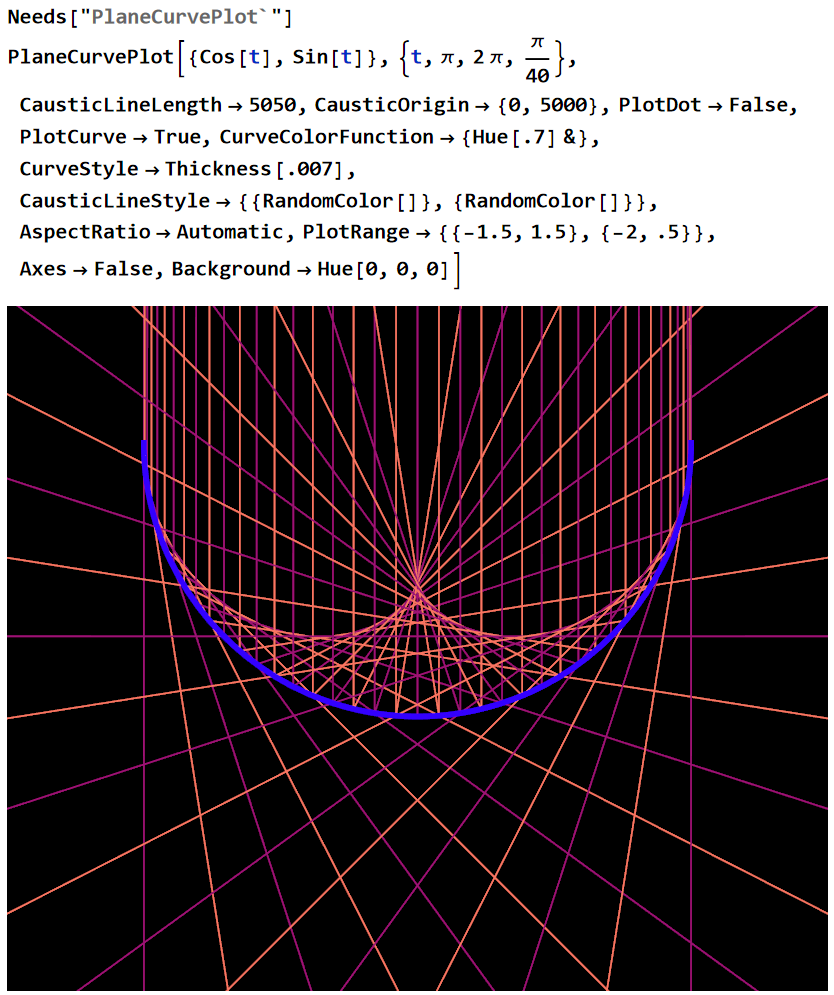
With[{
fcurve = Function[t, {Cos[t], Sin[t]}],
xrangeList = N @ Range[ Pi, 2 Pi, Pi/12],
lightSource = {9,20},
tangentLineLength = 60,
normalLineLength = 60,
causticLineLength = 60
},
Block[{tangentVecFun, curvePoints, tangentVecs, unitTanVecs }
,
tangentVecFun = fcurve';
curvePoints = Map[ fcurve , xrangeList];
tangentVecs = Map[ tangentVecFun , xrangeList];
unitTanVecs = Map[ Normalize , tangentVecs ] ;
With[
{
curveGra = ParametricPlot[Evaluate[fcurve[t]], {t, Pi, 2 Pi }],
curvePointsGP = {Blue, Map[ Point , curvePoints]},
tangentLinesGP = {Red, MapThread[ Function[{x,y}, Line[{x - y, x + y}]], {curvePoints, unitTanVecs} ] },
normalLinesGP = {Blue, MapThread[ Function[{xpoint, xunittanvec}, With[{xnormalvec= {-Last@xunittanvec, First@xunittanvec} * normalLineLength}, Line[{xpoint - xnormalvec, xpoint + xnormalvec}]] ], {curvePoints, unitTanVecs} ] },
causticLightRaysGP = {Cyan, Map[ Function[xpoint, Line @ {lightSource, xpoint}] , curvePoints] }
}
,
Show[curveGra, Graphics[ {tangentLinesGP , normalLinesGP , causticLightRaysGP, curvePointsGP } ], Axes -> True ]]
] ]

Clear[reflectVec]

"reflectVec[lightSource, wallV] return a vector that is the ray vector lightSource reflected off a wall vector wallV. The ray and wall vectors do not have to be unit vectors. warning: wallV cannot be zero vector. ";

reflectVec = Function[{lightSource, wallV}, - lightSource + (2*( wallV . lightSource * wallV))/(wallV . wallV) ] ;

causticLineGP::usage="
causticLineGP[tpoints, tangentVecs, rayOrigin, xlength]
return a list of Line[...].
They represent rays from rayOrigin shooting towards the points on the parametric curve and reflected.

Each line length is xlength, including the reflected portion.

if xlength is negative, it draws refraction. ";

causticLineGP = Function[{tpoints, tangentVecs, rayOrigin, xlength},
With[ {
xsign = Sign[xlength],
xlength2 = Abs[xlength]},
MapThread[
Function[{xpoint,xtanvec},
If[Norm[ xpoint-rayOrigin] >= xlength2,
Line[{rayOrigin , rayOrigin + Normalize[xpoint-rayOrigin]*xlength2}],
Line[{rayOrigin , xpoint, xpoint + Normalize @ reflectVec[xpoint-rayOrigin, xtanvec]* (xlength2 - Norm[xpoint-rayOrigin])* xsign}]
]
]
, {tpoints, tangentVecs}]
 ] ];

(* s------------------------------ *)

(* return the reflection ray vector that's from
rayOrigin
to
curve point xpoint,
with tangent vector xtanvec at xpoint.

the result is not normalized (not unit vector).
also, result is a vector. to get the position, you need to xpoint + resultVector.
 *)
reflectRayVec = Function[{xpoint,xtanvec,rayOrigin}, reflectVec[xpoint-rayOrigin, xtanvec] ];

With[
{xcurve = Function[x, {Cos[x],Sin[x]}] }
,
With[{xtanfun= xcurve' },
Show[
Graphics[
{
Red,
causticLineGP[
Table[ Evaluate @  xcurve @ x  , {x, 0, 6, 0.2}] ,
Table[ Evaluate @ xtanfun @ x , {x, 0, 6, 0.2}]
,
 {4,3} , 99]
}
,
Axes -> True,
PlotRange -> {{-1,1}, {-1,1}}2
],
ParametricPlot[ Evaluate @ xcurve @ x  , {x, 0, 6}]
]
]
]


xlightOrigin = {4,1}
lineVecA = {1,0}
lineVecB = {-1,0}

reflectVec[{4,1}, {0,1}]

reflectVec[{3,1}, AngleVector[1]]

reflectVec[{3,1}, AngleVector[20 Degree]]

{Cos[1], Sin[1]}