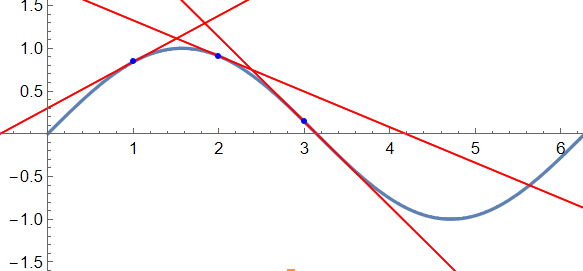
Tangent
 sine tangent 2026 t6TZ2
With[{
fcurve = Function[x, {x, Sin[x]}],
trange = {1,2,3},
tangentLineLength = 60
},
With[{fTangentVec = fcurve'},
Show[ParametricPlot[Evaluate[fcurve[t]], {t, 0, 2 Pi}],
Graphics[
Table[With[{xpoint = fcurve[t],
xtanvec = tangentLineLength Normalize[fTangentVec[t]]}, {{Red,
Line[{xpoint - xtanvec, xpoint + xtanvec}]}, {Blue,
Point[xpoint]}}], {t, trange}]], Axes -> True,
PlotRange -> {{-0.3, 6}, {-1, 1} 1.5}, AspectRatio -> Automatic] ] ]
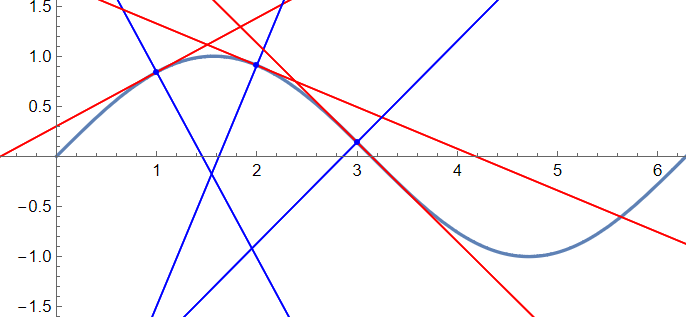
Normal
 sine normals 2026-03-07 15fc7
With[{
fcurve = Function[x, {x, Sin[x]}],
xrangeList = {1, 2, 3},
tangentLineLength = 60,
normalLineLength = 60
},
With[{fTangentVec = fcurve'},
Show[
ParametricPlot[Evaluate[fcurve[t]], {t, 0, 2 Pi}],
Graphics[
Table[
With[{
xpoint = fcurve[t],
xunitTanVec = Normalize[fTangentVec[t]]},
With[{
xtanvec = xunitTanVec * tangentLineLength,
xnormalvec = {- Last @ xunitTanVec, First @ xunitTanVec} * normalLineLength
},
{
{Red, Line[{xpoint - xtanvec, xpoint + xtanvec}]},
{Blue, Line[{xpoint - xnormalvec, xpoint + xnormalvec}]},
{Blue, Point[xpoint]}}] ],
{t, xrangeList}]],
Axes -> True,
PlotRange -> {{-0.3, 6}, {-1, 1} 1.5},
AspectRatio -> Automatic]]]